- BTC needs to hold above $50,000 to maintain the bullish momentum.
- AVAX’s 500% rally eyes the February 10 ATH at $63.159.
- ADA is currently massively overbought after rallying approximately 7.8% over the last 24 hours.
- DASH price has had six straight bullish sessions and reached a three-month highest level today at $285.
- AUDIUS price prediction remains bullish after rallying 101% in one week to reach an eight month-high above $4.1 on August 17.
Bitcoin price is facing overhead pressure from around the $50,000 psychological level. Data from Coinbase shows that bulls are struggling to keep the BTC price above $50,000 as seller hold their ground.
However, Bitcoin price prediction remains bullish after the bellwether cryptocurrency rallied 72% from the July low around $29,280 to Monday August 23’s intraday high around $50,650.
However, on-chain metrics from IntoTheBlock show that show that a lot of investors (3.7 million addresses) are holding approximately 1.01 million BTC between the $50,000 and the all-time high above $64,000 price range. These traders might want to break even. The Relative strength indictor also shows that BTC is currently oversold suggesting that the bullish momentum might soon get overheated. This might trigger a pull-back for Bitcoin in the near future which is likely to carry the rest of the crypto market with it.
Despite this pessimistic outlook, institutional adoption of cryptocurrencies continues to increase. In the latest news is the online payments giant PayPal announcing the launch of cryptocurrency services to its UK customers.
With this, PayPal joins a growing list of companies that are continuously adopting blockchain technology and cryptocurrencies.
According to the Independent, these news have helped spark the record-breaking price rallies that have since pushed the overall cryptocurrency market capitalisation above $2 trillion, ranking it above the likes of Amazon, Facebook and Alphabet (Google) in terms of overall value.
If Bitcoin price holds above $50,000, it will sustain the bullish momentum that is likely to pull up altcoins as well.
Let’s look at the charts of the top-5 cryptocurrencies to are likely to attract investors this week.
Bitcoin (BTC/USD)
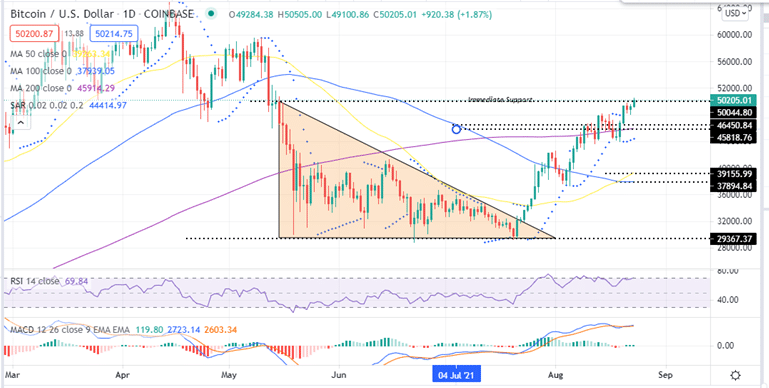
Bitcoin price remains bullish as it trades above the price range defined by the descending triangle. This suggests that the bulls are in control and are aggressively defending the immediate support embraced by the $50,000 psychological level.
If Bitcoin price closes the day above the $50,000 level, the bulls will be bolstered to resume the uptrend opening the door for a rally towards the ATH above $64,000.
The upsloping relative strength index (RSI) into the overbought region and the positive parabolic SAR suggest that bulls are in control. Moreover, the MACD sent a buy crypto signal on August 21 when it crossed above the signal line and has continued to move above the zero line in the positive region validating BTC’s bullish bias.
On the flipside, a drop and a daily close below the $50,000 mark will take the Bitcoin price back within the descending triangle price range invalidating the bullish pattern. If this happens, Bitcoin could drop to the 200-day SMA of $46,450. A further drop below this level, BTC may drop to the 50-day SMA at $9,155 or the 100-day SMA at $37,894.
Capital at risk
Avalanche (AVAX/USD)
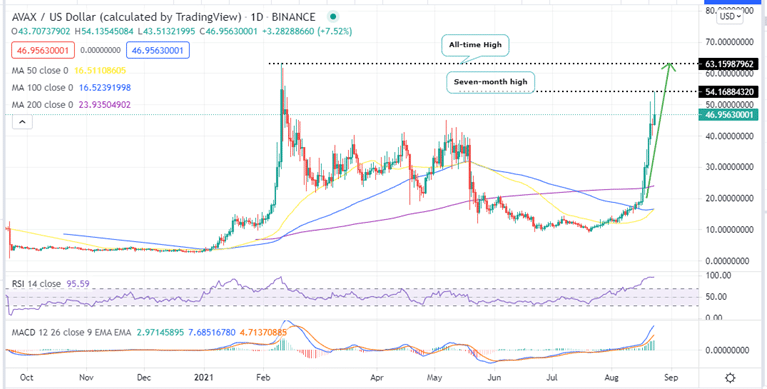
Avalanche has rallied 506% from the July 20 low at $8.93 to reach a seven-month high at above $54 earlier on Monday. AVAX bulls remain focused on gains targeting the all-time high (ATH) around $62.
A clear breakout above $50 will provide the hind wind needed to propel the Avalanche price beyond $60. AVAX is dancing at $48.51.
The bullish AVAX price is underpinned by the latest development regarding the BENQI, the first DeFi lending platform on Avalanche which was launched last Thursday and already has over $1Billion in Total Value Locked. Note that it took Aave 8 months to reach the same amount when it launched.
All this is attributed to the liquidity mining program in collaboration with the Avalanche platform for boosting DeFi growth. Specifically, BENQI — an algorithmic liquidity market protocol, will mark the next phase of growth for Avalanche’s DeFi ecosystem.
This next phase is expected to focus on the expansion of high-performance financial primitives, like money markets. The co-founder of Avalanche, JD Gagnon said that the launch of the Avalanche Bridge:
“… has proved to be a major catalyst for the rush of liquidity to not only BENQI, but the rest of the Avalanche DeFi ecosystem. A big thank you to everyone involved! We’re currently optimizing the protocol, and have plans to collaborate with projects going cross-chain to Avalanche as part of the Avalanche Rush initiative.”
Avalanche is an open-source platform for launching dApps and enterprise blockchain deployments in one interoperable, highly scalable ecosystem. AVAX is the native token of Avalanche.
With this news, the Avalanche recovery that started on July 21 continues as AVAX eyes the February 10 ATH at $63.159.
Note that Realize that a decisive break above $50 and subsequent higher support will bolster bulls to regroup and carry on with the journey towards all-time highs. Moreover, settling above $50 would see holders collect profits, which may trigger another bullish opportunity.
The Moving Average Convergence Divergence (MACD) indicator on the daily chart reveals that bulls are in control of the Avalanche price. This is indicated by the upward movement of the MACD line above the signal line in the positive region.
The bullish outlook is reinforced by the Relative Strength Index (RSI) on the same timeframe which reveals that buyers are indeed in control. However, the overbought conditions risk a correction occurring in the near term.
Note that if AVAX/USD price closes the day below the immediate support at $41, a massive correction will occur which would see Avalanche retreat towards $30 psychological level or the 200-day SMA at $24.
Capital at risk
Cardano (ADA/USD)
Cardano price is currently massively overbought after rallying approximately 7.8% over the last 24 hours to set a new record high at around $2.96 on Monday. This rally has seen ADA overtake the Binance coin to become the third most valuable cryptocurrency globally.
So, what does the week look like for Cardano?
Cardano price forecast is strongly bullish above at the current price teetering at $2.907. On the 12-hiur chart the Fibonacci retracement tool is likely to provide resistance at the $2.87 level. This level marks the 2.618% Fibonacci extension level for ADA/USD. The breakout above this level could drive additional buying until the 3.618% extension level of $3.26.
This bullish narrative is accentuated by the sharp rise of the RSI into the overbought zone as well as the upward movement of the MACD above the zero line in the positive region as seen on the daily chart. It is worth noting the MACD sent a buy signal on August 22 on the 12-hour timeframe when the MACD line crossed above the signal line. This validates Cardano’s bullish thesis.
Also note that a bullish signal might flash in the near future when the 50-dal SMA crosses above the 100-day SMA on the daily chart. Though this is not golden cross, it is an indication that the bullish momentum may be sustained for a bit longer.
ADA/USD Daily Chart
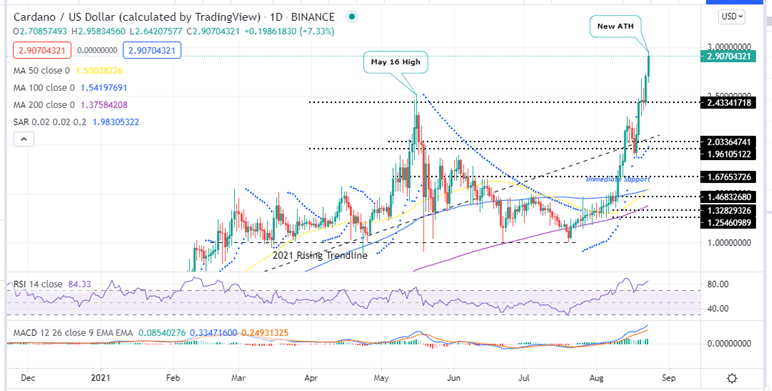
The ADA/USD is sitting on immediate support at $2.60, and a fall below this level could extend the selling trend until the next support level of $2.40.
A further fall downwards could see Cardano cross below the 2021 rising trendline to retest the 50and 100 SMAs at $1.54 or the 200 SMA at $1.36.
Capital at risk
DASH/USD
DASH price has jumped approximately 17% in price over the last 24 hours after closing the day on Sunday at $255.19 after placing a high of $256.73 and a low of $230.64. Currently, Dash is trading sharply bullish at $273. The DASH/USD price is trading in the green for the sixth bullish session and reached a three-month highest level today at $285 amid the latest improvements in the network. If you are wondering what to expect from DASH this week, let’s find out below…
DASH appears to have formed a rounding bottom pattern on the daily chart after the sell-off was halted at $106. Note that this pattern forms when an asset initially descends toward a low indicating an excess of supply. The reversal to an upward trend occurs when buyers enter the market at a low price, which increases demand for the asset. Once the rounding bottom is complete, the asset breaks out and will continue in its new upward trend.
A breakout from this bullish pattern will occur when DASH closes above the price immediately prior to the start of the initial decline at the $305 mark. If this happens, DASH/USD could explore the $320 psychological level.
DASH/USD Daily Chart
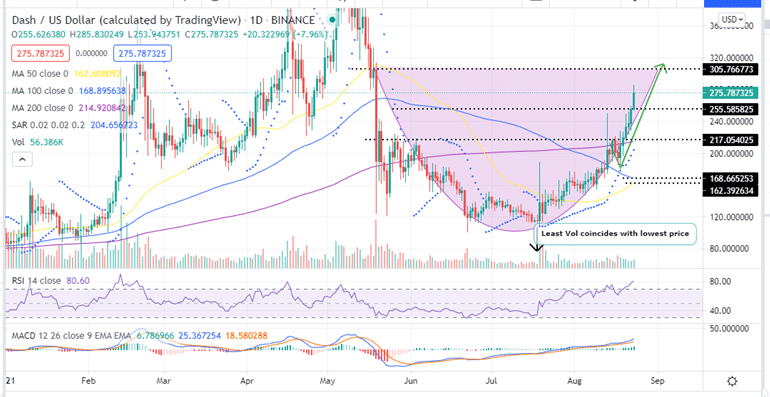
This bullish outlook is validated by the RSI’ upward movement in the overbought zone and the position of the MACD above the midline in the positive zone.
Note that a breakout below the current support at the $255level now could lead the DASH price towards the 200-day SMA at $217. Any further drop would see DASH re-test the 100 and 50 SMAs at $168 and $162 respectively.
Capital at risk
Audius/USD
The Audius price has shot up remarkably, practically doubling in value over the past 7 days, from a low of $1.51 on August 16 to the current price at $3.1, representing approximately 101% rise. This rally has seen AUDIUS reach an eight month-high above $4.1 on August 17.
Rejection at the $3.6 level saw the asset retreat to seek support at the $2.8 support wall. However, the bulls were not strong enough to maintain this bullish bias as the bears took over on Friday in attempt to undo the recent gains.
Since then, Audius has traded in three straight bearish sessions but today’s bullish session indicates that the bulls are back in town and are focused on overcoming the May 27 high.
This still makes AUDIUS one of the best cryptocurrencies to buy this week.
Note that a breakout above the immediate resistance at $3.3 will push AUDIUS/USD price above the $4.0 psychological level.
AUDIUS/USD Daily Chart
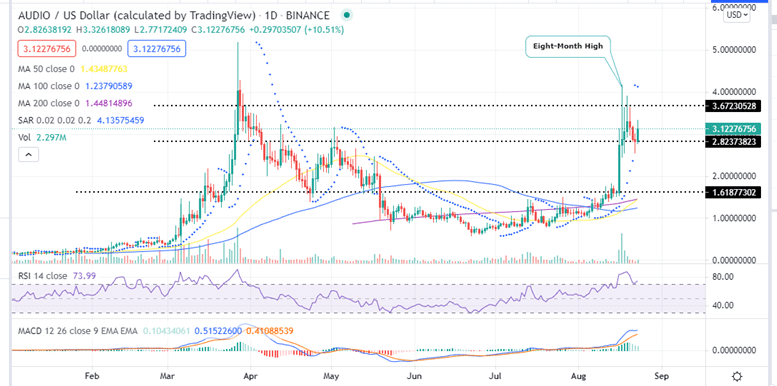
This bullish outlook is accentuated by the position of the RSI in the overbought zone at 75.6 indicating that bulls are still controlling then Audius market.
Also note that the upward movement of the MACD line above the neutral line in the positive zone is a bullish sign. Also its continued movement above the signal line adds credence to the bullish thesis.
On the flipside, if AUDIUS/USD closes the day below the support at $2.82, it will recoin towards the 200,50 and 100 SMAs.
Capital at risk
Where to Buy BTC, ADA, AVAX, DASH and AUDIUS
If you want to trade these cryptocurrencies, you can do so on the following crypto exchanges:
- eToro
eToro is one an FCA regulated platform with over 20 million user globally. eToro charges low trading fees and commissions. - FTX
FTX is one of the largest exchange platforms that supports a wide range of cryptocurrencies and trading pairs. It also offers user-friendly features.
Get Free Crypto Signals – 82% Win Rate!
3 Free Crypto Signals Every Week – Full Technical Analysis
