Many traders make the mistake of entering trades without looking at the long-term charts. This mistake can influence the outcome of the trade as the daily chart might not show a major support or resistance zone which can only be seen on the weekly or monthly charts.
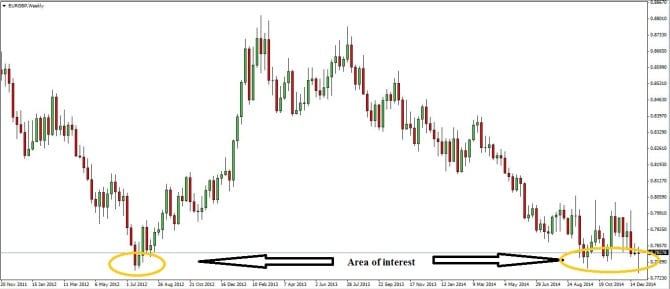
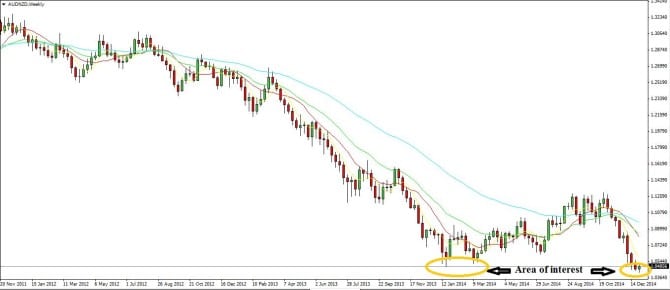
We will look into 3 setups based on the weekly time frames. Before I go into details, look at the attached weekly charts on three pairs: AUD/NZD, EUR/USD and EUR/GBP. I also leave some work for you: the monthly charts have great value for all 3 pairs but you have to look them up on your own by opening the platform and finding the charts. After you observed all three pairs, we can start the analysis on them.
Guest post by Tamás Sziládi
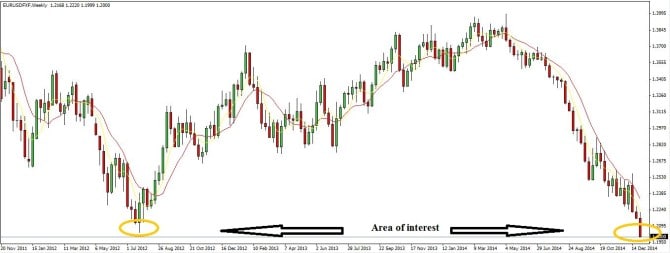
After looking at the charts, we have to think about how we can take advantage of these setups. I share my thoughts with analyzing the EUR/USD pair more deeply.
- Identifying the possible setup with looking at the charts
This step is obvious. If we do not look at the charts we cannot take advantage of it. I assume you did this step so we can move on.
- Decide the fundamental direction of your setup.
It is crucial to decide what scenario is most likely to occur in the long-term when we arrive to a support zone. Is the pair going to reverse or continue to fall beyond the support zone? This is the part of the trade where you have to decide on your own what is likely to happen.
- Take advantage of the technical and fundamental factors
There are more possibilities to take advantage of major support and resistance zones. In our case we have identified 3 major support zones and we will look into the EUR/USD pair to see what the possible scenarios are.
In case you are a very long term trader who entered short on the EUR/USD pair and do not like to look at the charts often, you might decide to just sit through the breaking of the 1.2000 level. In this case we assumed that the 1.2000 level breaks. This is the simplest way to trade the EUR/USD support zone but maybe not the best way.
As I said you have to decide on your own what are the fundamental factors for a currency. If you think the USD rally is over then you can make a buy order at the 1.2000 level but do not forget to set a stop loss order under the major support zone in case you are wrong. The pair has actually arrived to the major level at market close so you do not even have to wait to enter this setup if you believe a reversal is going to happen.
It gets trickier if you think the pair will fall further down. This scenario is tricky because you have to decide what to do if the pair does not break the 1.2000 level. A possible option is to take profits for one part of your position before a test of the 1.2000 level, just in case the trend would turn. Taking profits is always good as you make unrealized profits turn into realized profits and it will increase your account balance. It has also the advantage that in case the pair breaks easily the support zone then you still have one part of the trade open and ride the trend further on. If you are more of a risk aversion type of trader and have a bearish bias on the pair you can close your whole position and take profits before the test of the support zone.
In this case you have two options to enter a short order again:
- if there was a retracement and you think it is over and you get in at a better price, for example at 1.2090
- if you want to play it very safely then wait for a breakout to the downside and enter again at the 1.1950 rate when you are confirmed that the support zone has fallen.
You can approach the two other setups the same way. EUR/GBP has already tested the major support zone and bounced back from it, while AUD/NZD just arrived to the level and did not break it through on the first attempt.
Do you plan to trade these setups? If yes, what is your strategy?
