- TRON’s coin staged an impressive recovery late on Monday.
- TRX/USS is one of the best-performing coins out of top-20.
At the time of writing, TRX/USD is changing hands at $0.0163. The coin has grown bu over 10% in the recent 24 hours amid strong recovery on the cryptocurrency market. TRX has been on recovery mode since September 24, when the price hit $0.0117. Currently, the coin takes 11th place in the global cryptocurrency market rating with a market value of $1 billion.
TRX/USD, the technical picture
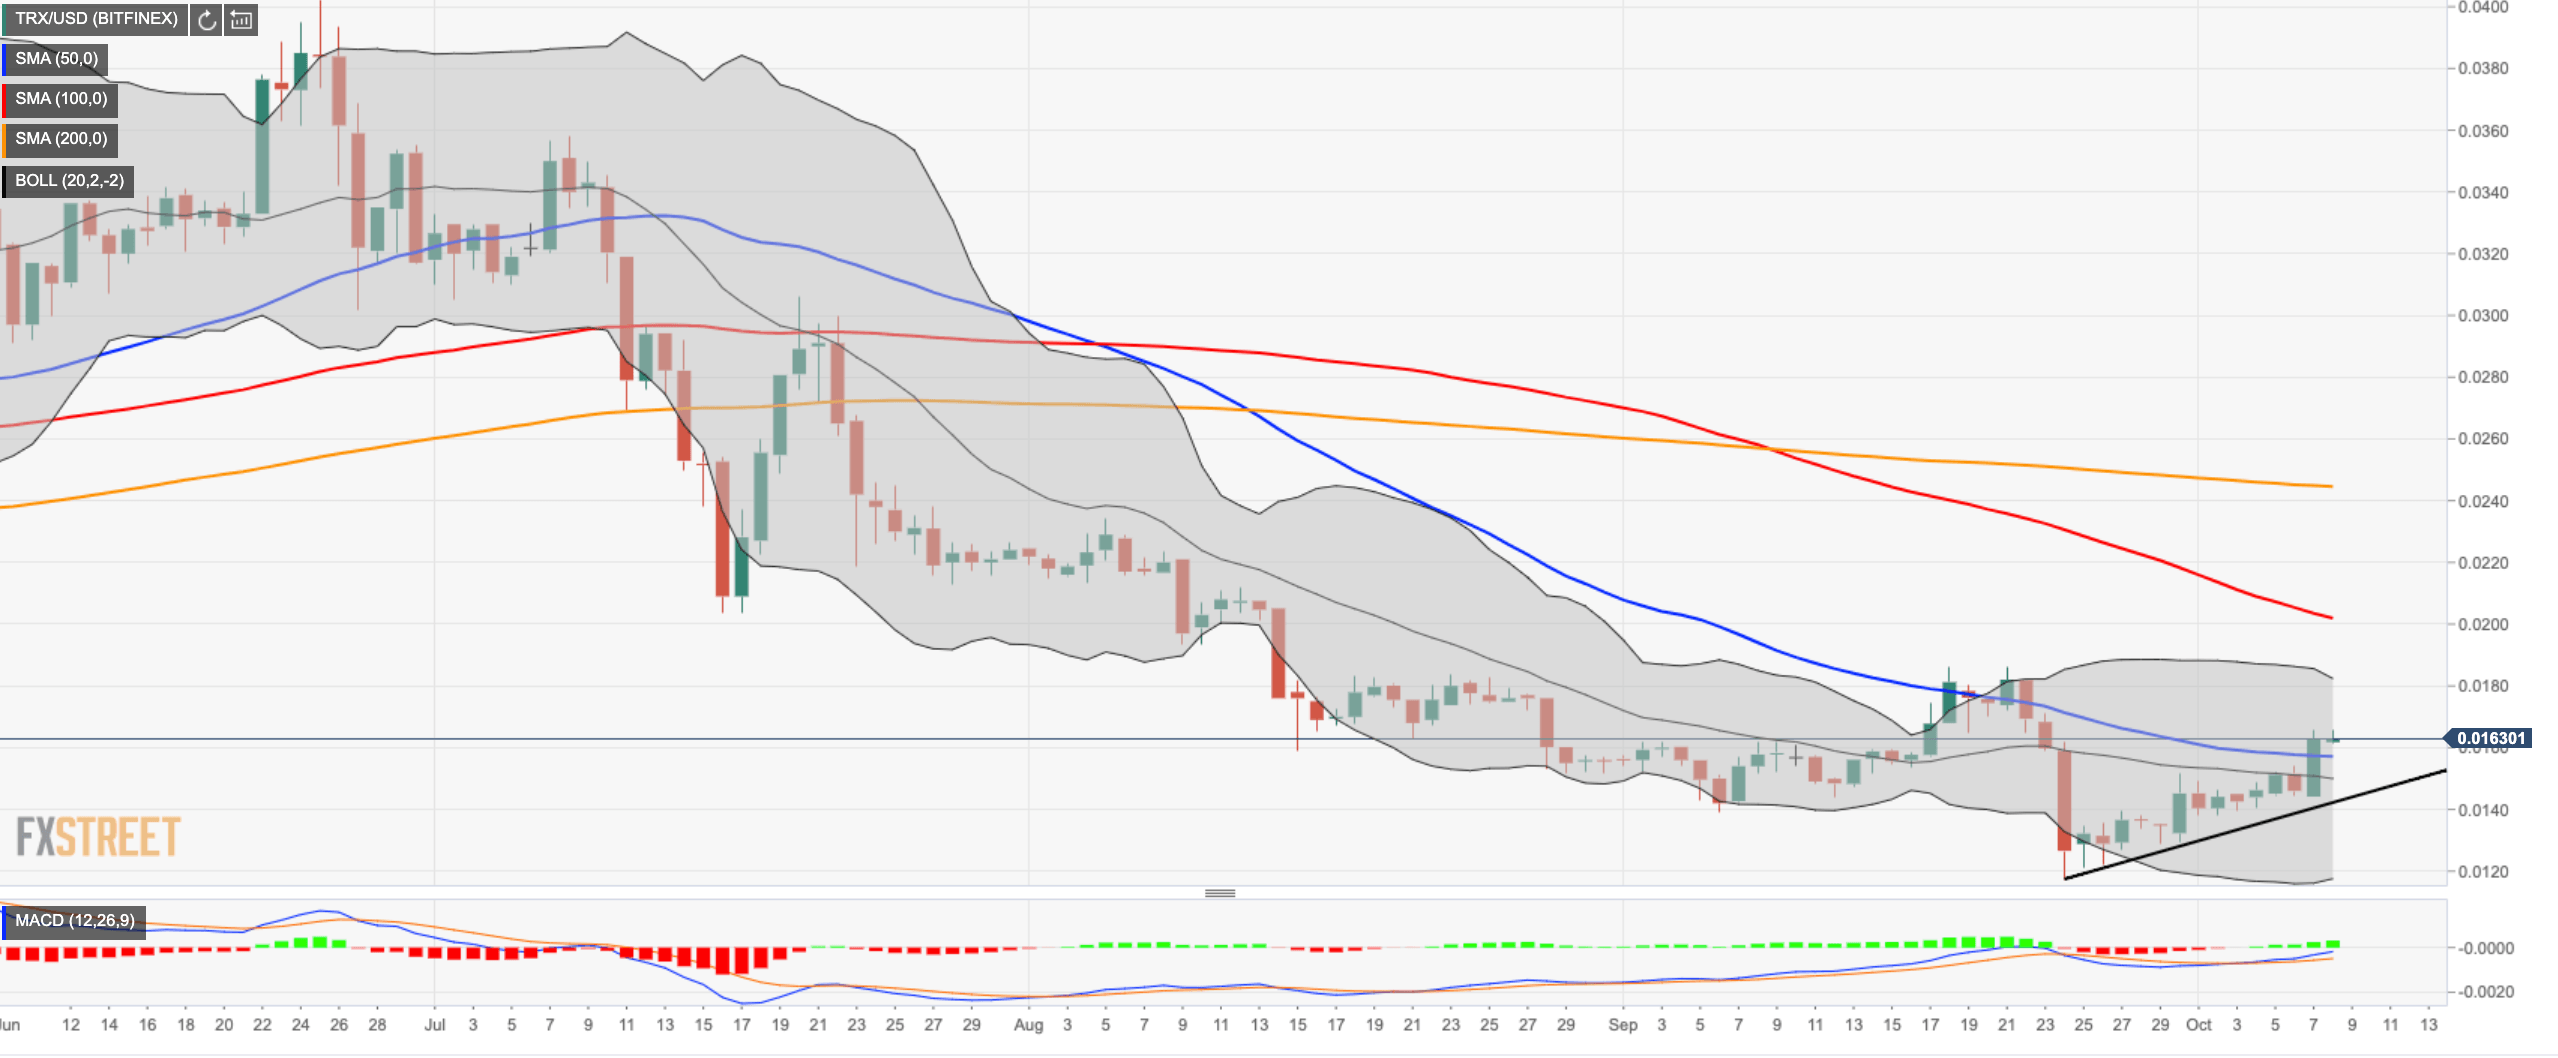
Looking technically, TRX/USD used the rising trendline from the above-mentioned low as a jumping off ground for a good recovery. A strong upside momentum pushed the price above SMA50 (Simple Moving Average) daily at $0.0157 and above psychological $0.0160. If the breakthrough is confirmed, thee recovery may gain traction with the next focus on $0.0182 area, which contains the upper line of four-hour Bollinger Band and the previous recovery high.
On the downside, a sustainable move below SMA50 daily might increase the selling pressure. The next support is created by psychological $0.0150 and the middle line of the Bollinger Band on a daily chart (currently at $0.0149). The ultimate support awaits us on approach to the rising trendline at $0.0142.
TRX/USD, daily chart