- TRON’s coin returned to the area above the trendline.
- TRX/USD is vulnerable to further losses if the recovery fails to gain traction.
At the time of writing, TRX/USD is changing hands at $0.0156. The coin has lost over 5% in seven 24 days, and the downside momentum is still strong. Currently, TRON takes the 11th place in the global cryptocurrency market rating with the market value of $1.- billion and an average daily trading value of $616 million.
TRX/USD, the technical picture
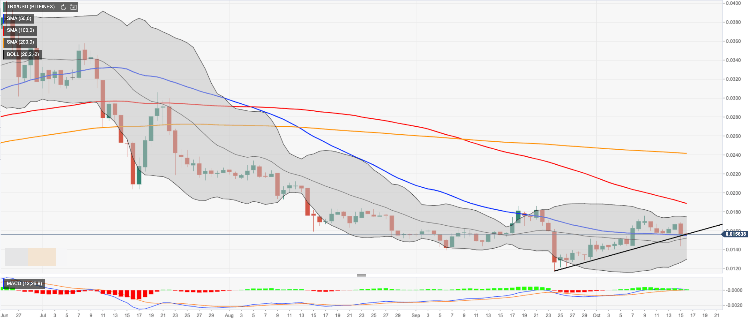
After a short-lived collapse, TRX/USD returned to the area above the upside trendline from the recent low of $0.0117. While this is a positive signal, the coin needs to regain ground at least above $0.0168 (Tuesday’s high) to stay within the short-term bullish trend. Once this barrier is out of the way, the upside is likely to gain traction with the next focus on $0.0174. This resistance is created by the upper line of the Bollinger Band on the daily chart. Also, a significant barrier awaits us on approach to $0.0188 (SMA100 (Simple Moving Average) on a daily chart).
On the downside, the initial support is created by SMA50 (Simple Moving Average) on a daily chart at $0.0154. It is closely followed by the middle line of the daily Bollinger Band. A sustainable move below this area will allow for an extended downside correction towards Tuesday’s low of $0.0143 and the lower line of the daily Bollinger Band at $0.0130.
TRX/USD, daily chart