Tron price is trading in the green for the Seventh day running as bulls are focused on regaining last week’s losses. The upward surge has seen TRX rise by approximately 37% from the July 20 low at $0.048 to yesterday’s high at $0.066. During rise, the Moving Average Convergence Divergence (MACD) indicator has flashed a sell signal, the parabolic SAR has flipped from negative to positive and the 20-day Simple Moving Average (SMA) has flipped from resistance to support.
Tron Price Double-Bottom Pattern Targets $0.070.
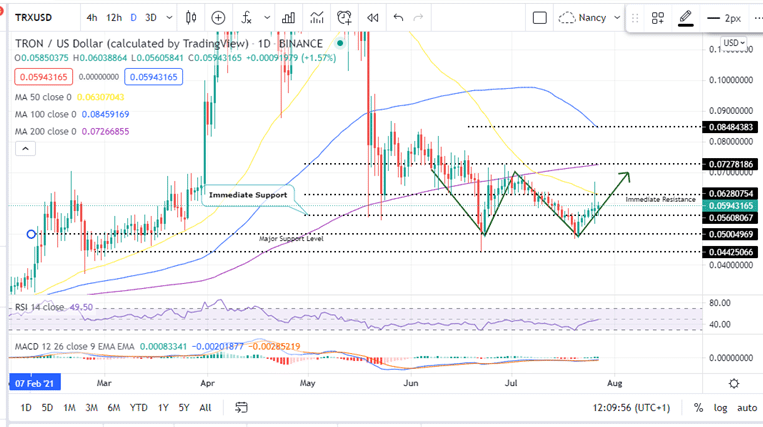
A look at the TRX price daily chart shows that Tron is nurturing a double-bottom pattern after last week’s sell-off was stopped at around $0.050. It is around the same zone that the previous bearish run that started on May 9, was stopped on June 22. This confirms the formation of the double-bottom pattern.
Note that a double-bottom chart pattern is formed when an asset reaches a support level two times without going below it. The two bottoms are usually separated by a moderate peak as seen on the Tron price daily chart. A double-bottom pattern is usually a bullish pattern that often shows that bulls control the market from the bottom towards the peak area.
At the time of writing, Tron was hovering around $0.059 as bulls battle immediate resistance at $0.062 which coincides with the 50-day SMA.
Note that a breakout towards the $0.070 at the peak will be validated when TRX closes the day above the 50-day SMA at $0.059. A breakout from the technical pattern will be confirmed when the Tron price overcomes the resistance at the peak ($0.070) to explore the May 29 high at $0.087.
This breakout could, however, be curtailed by resistance poised by the 200-day SMA at $0.072 and the $0.080 psychological level.
Tron Price (TRX/USD) Daily Chart
The Moving Average Convergence Divergence (MACD) and Relative Strength Index (RSI) add credence to this bullish outlook as seen on the daily chart. The current position of the MACD above the signal line indicates that the Tron price is still bullish. Note that investors responded to the buy crypto signal when the MACD line (blue) crossed over the signal line on July 21 and again on July 25. Note that Tron’s upswing will gain more traction when the MACD crosses the neutral line into the positive region on the daily chart..
Looking Over the Fence
Note that a daily closure below the immediate Tron price support at $0.056 will invalidate the bullish thesis and trigger sell-orders. If this happens, TRX might retract to $0.050 or even re-test the June 21 low at $0.044.
If you are seeking to trade Tron, read this guide on crypto brokers to get started.
Looking to buy or trade Tron now? Invest at eToro!
Capital at risk
