- TRX is currently trading at $0.026 inside a descending parallel channel on the daily chart.
- Several indicators are showing that Tron is ready for a massive price move soon.
For the most part, TRX has been trading sideways in the past week. Bulls saw a notable spike on October 12 towards $0.0278, however, it was a short-lived movement testing the upper boundary of the descending parallel channel on the daily chart.
Tron is ready for a price explosion
Not only TRX is trading inside a parallel channel, but the Bollinger Bands are getting squeezed significantly over the past week, indicating that a major price move will happen soon. The last time the BB indicator got this point, the price of TRX exploded by 74% to the upside.
TRX/USDT daily chart
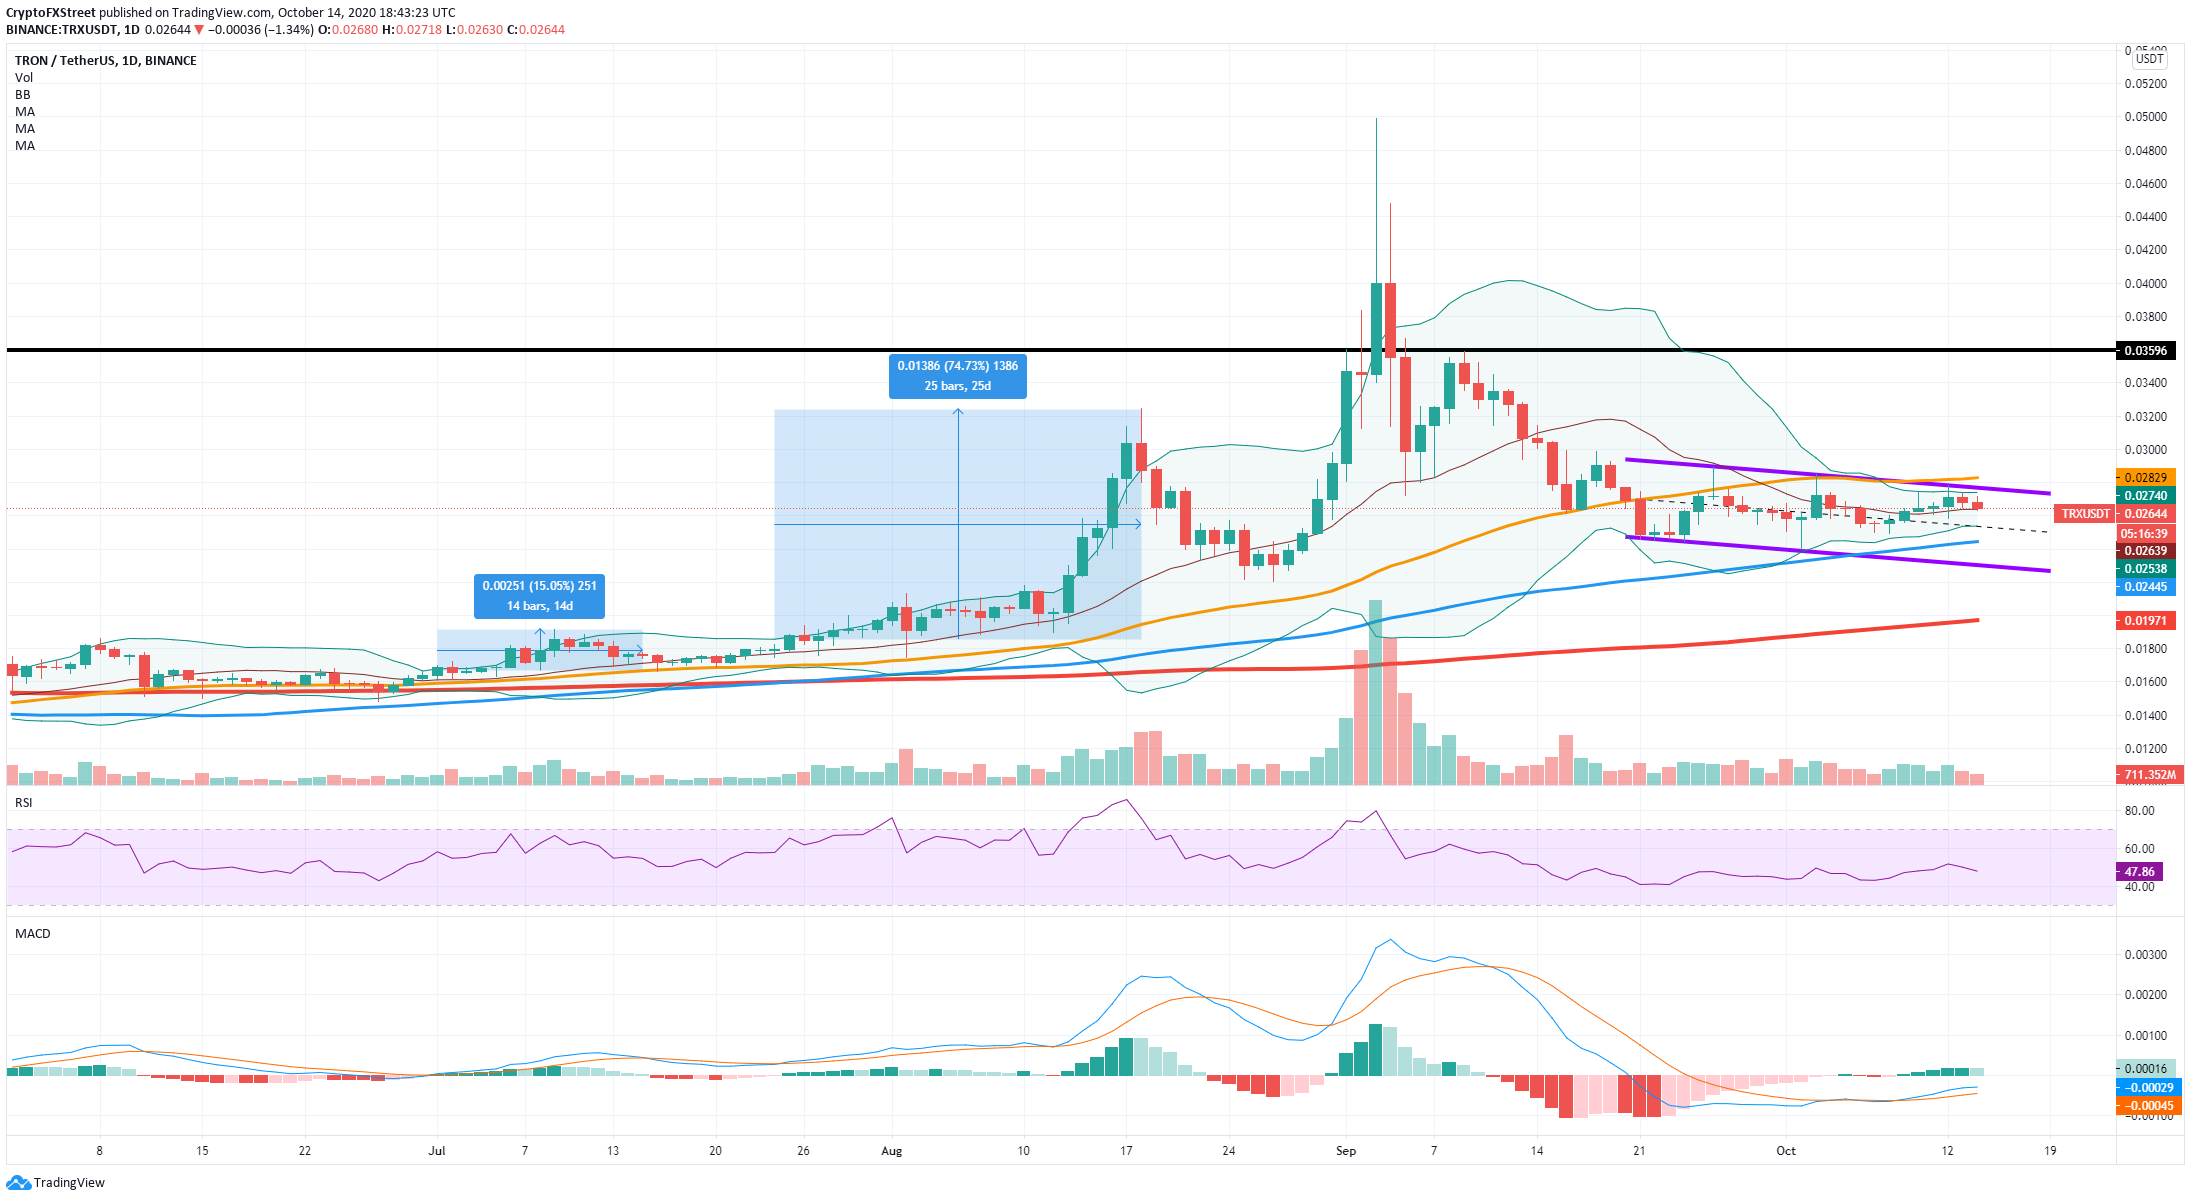
A breakout above the upper boundary of the Bollinger Bands is more significant now because it coincides with the trendline of the descending parallel channel and the 50-SMA. A bullish breakout will easily push TRX to $0.03 and up to $0.036 in the short-term.
TRX/USDT 12-hour chart
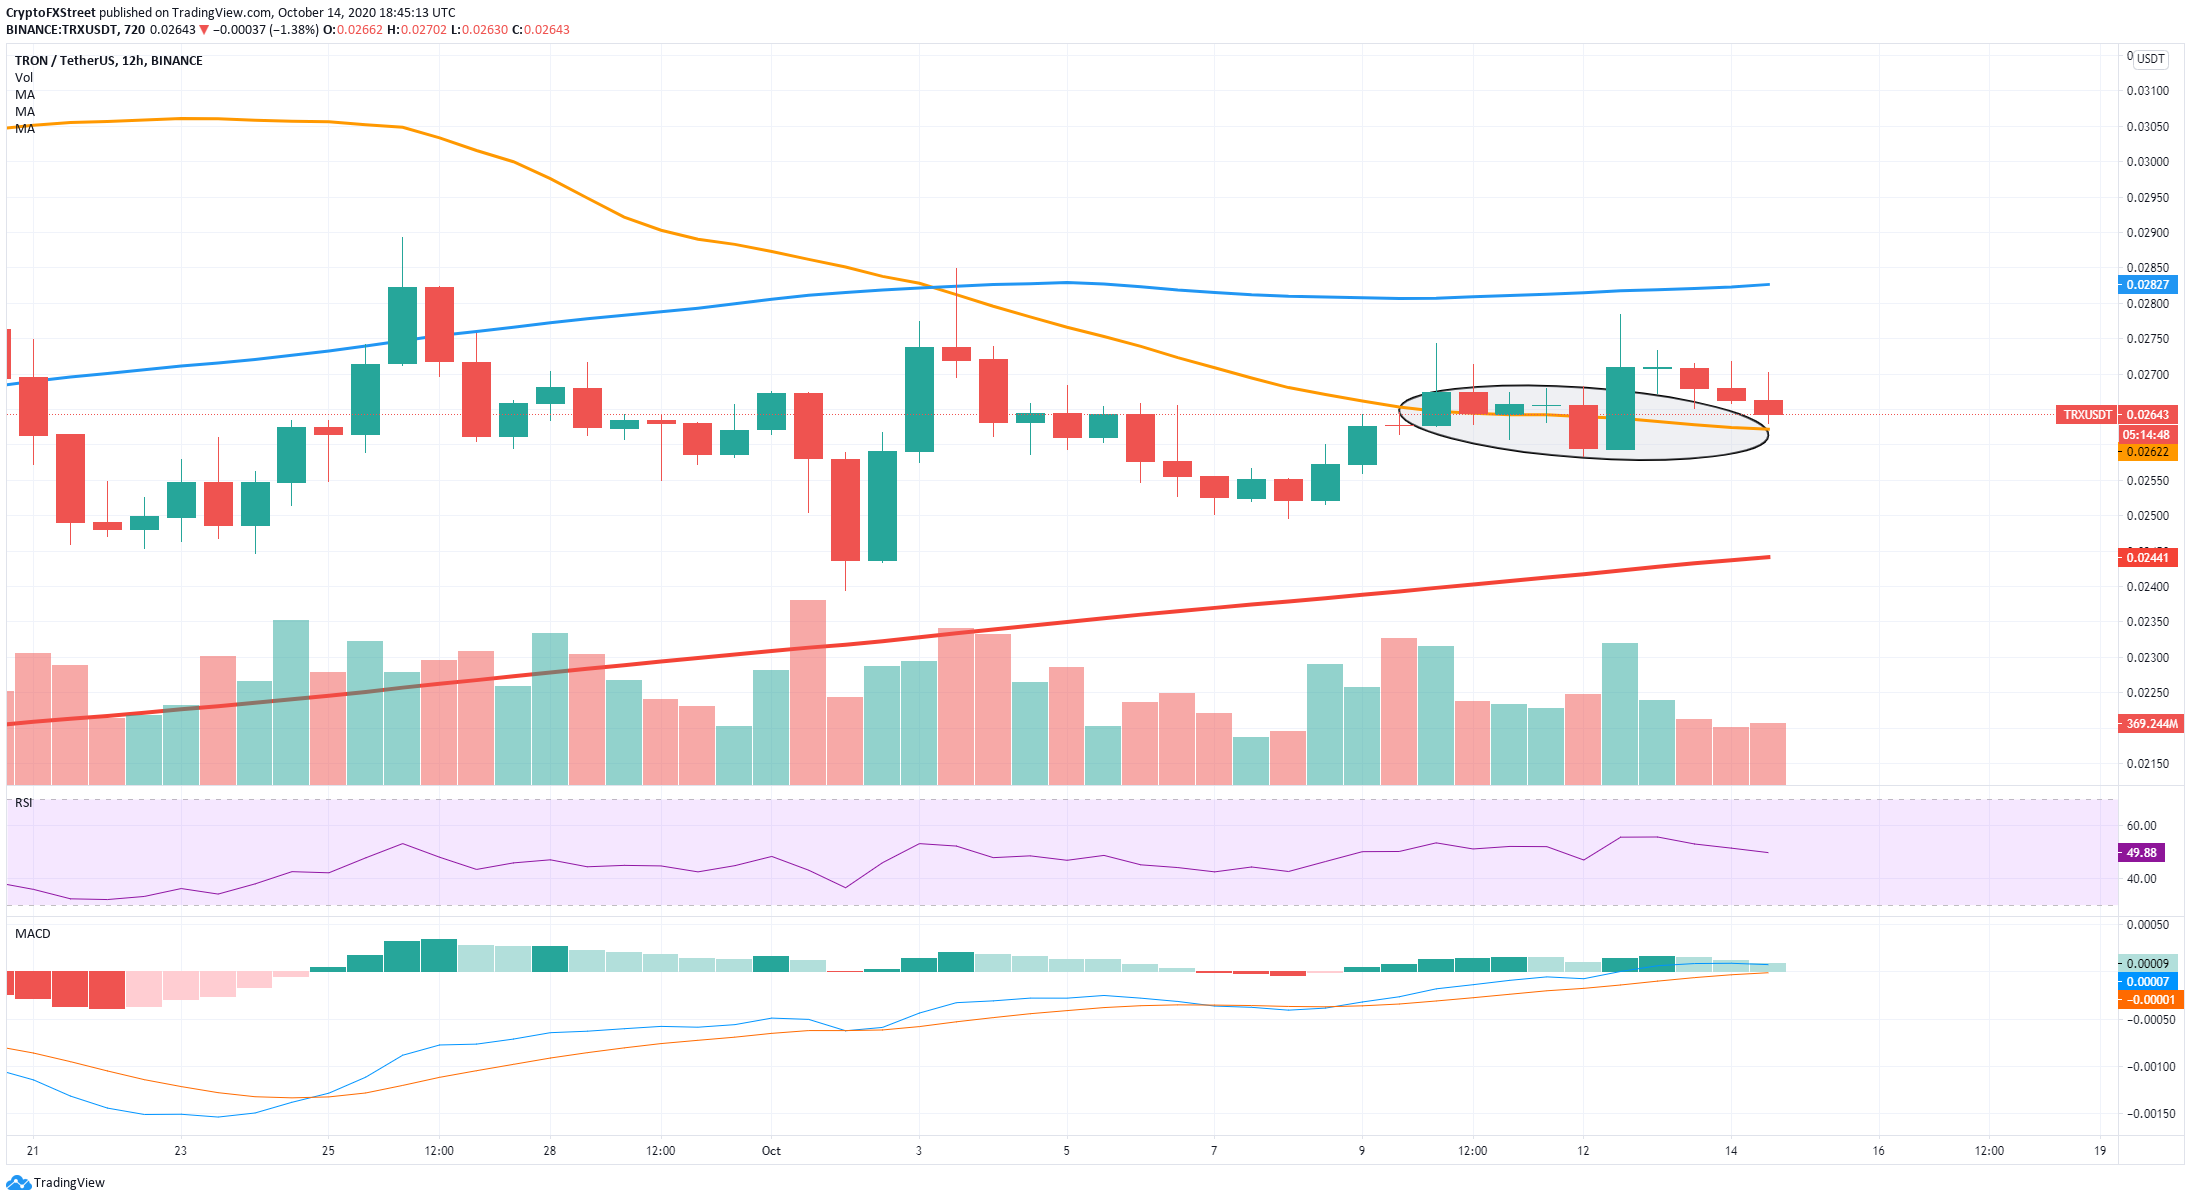
On the 12-hour chart, the MACD turned bullish on October 9 and has strengthened significantly since then. The 50-SMA is acting as a strong support level despite TRX piercing below it on several occasions. The RSI is not overextended which means bulls have a lot of space to work with.
TRX/USDT 1-hour chart
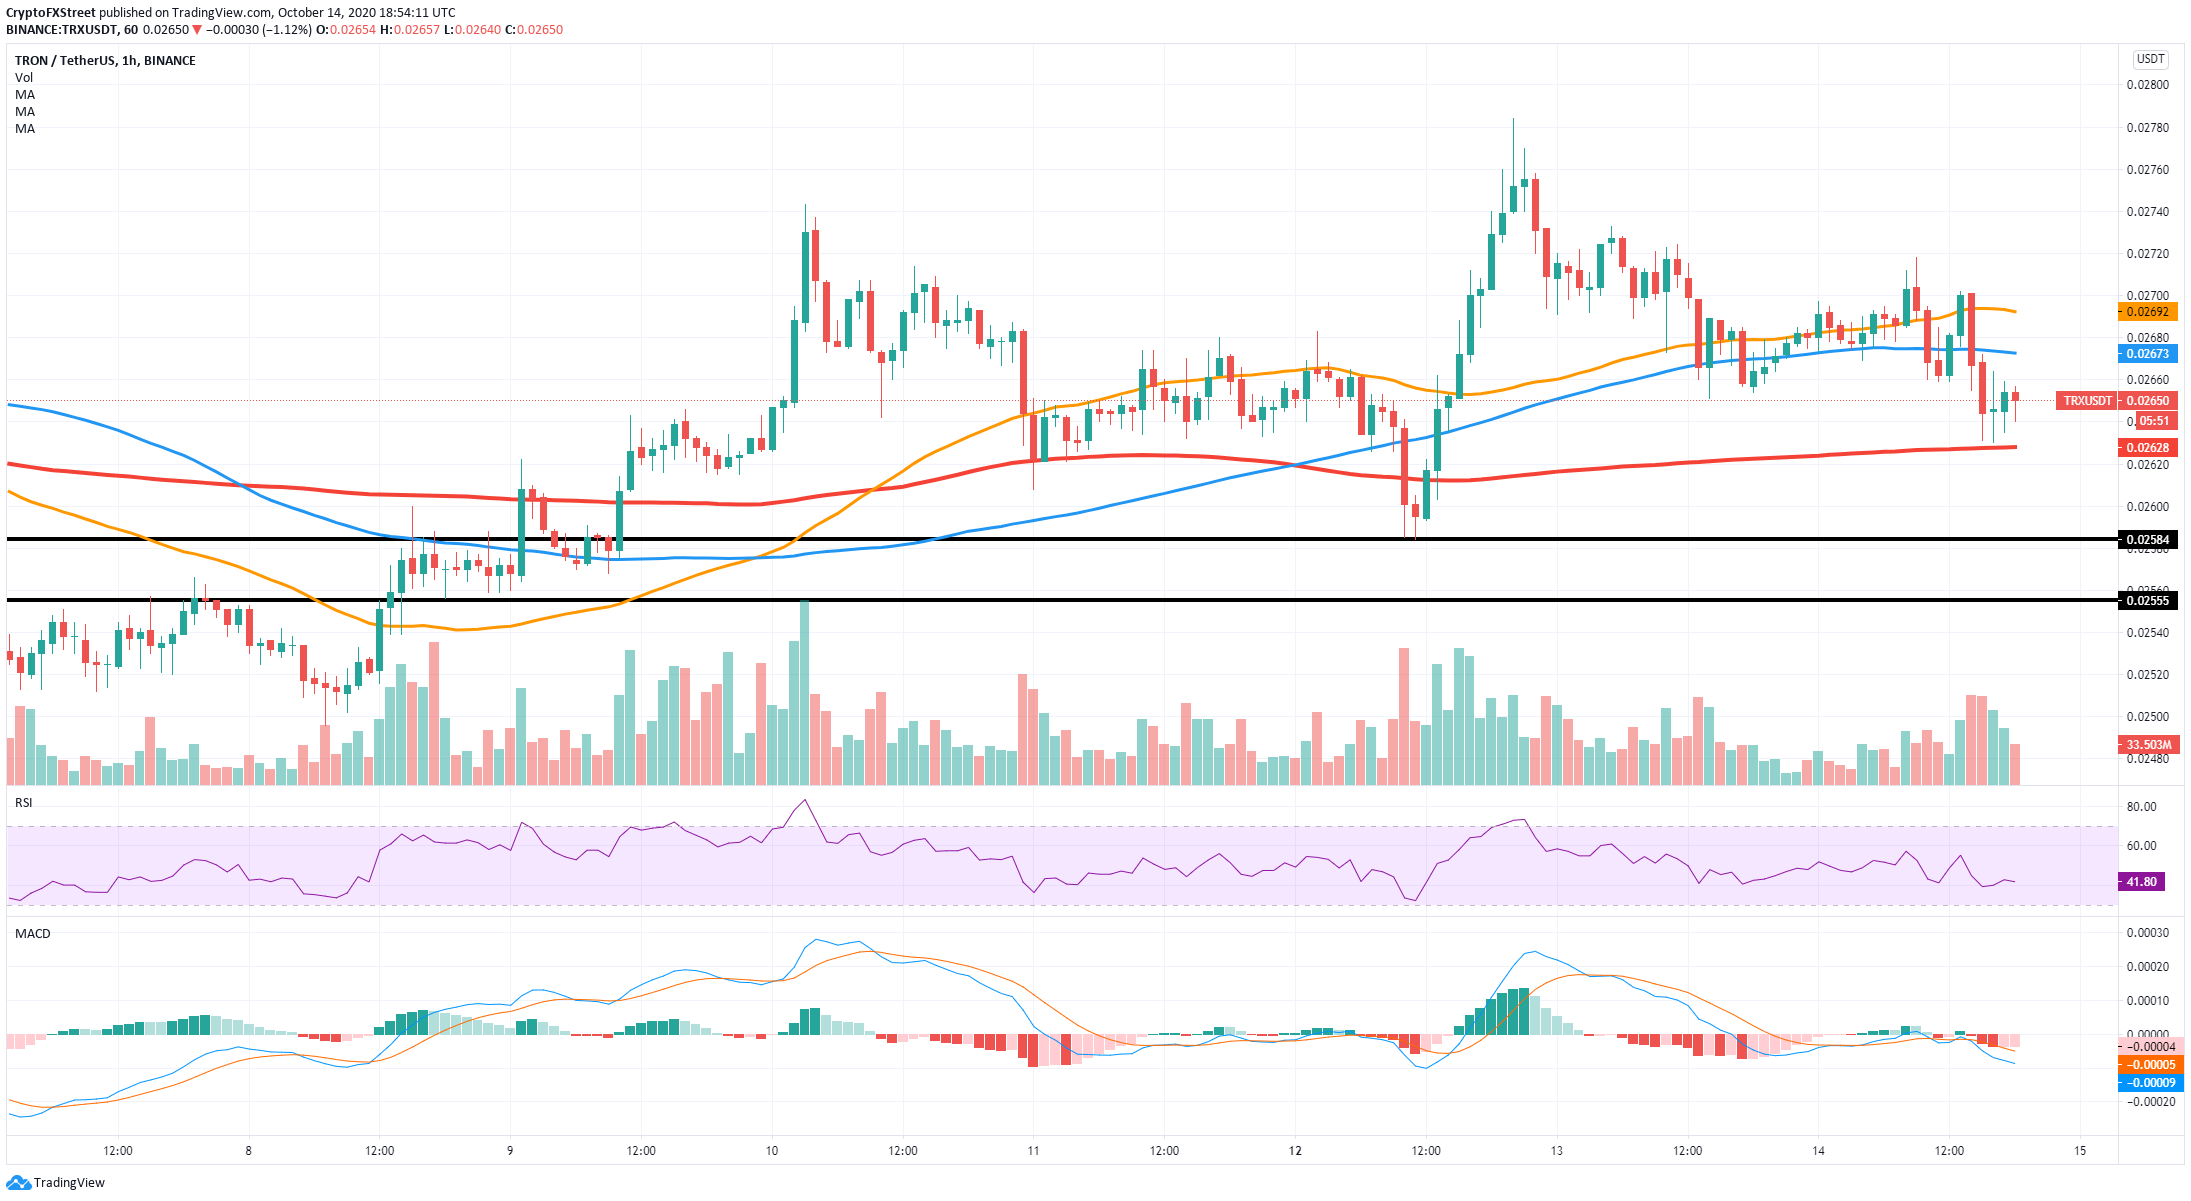
On the other hand, shorter time-frames like the hourly chart are showing the momentum is shifting in favor of the bears. The price has slipped below the 50-SMA and the 100-SMA towards the 200-SMA. The MACD turned bearish and it’s gaining strength.
The next support level is located at $0.0262, where the 200-SMA currently stands. A bearish breakout below this point can push TRX down to $0.0258, the low of October 12, and even $0.0255, a support level established on October 8.
Important price points to look out for
We know Tron is trading between two defined price points and the Bollinger Band indicator is showing that a major price move is underway. A bullish breakout above the upper boundary of the parallel channel can potentially push TRX towards $0.036.
On the flip side, a rejection from the same upper trendline can shift the odds in favor of the bears, which are already in control over the hourly chart. A bearish breakout below the 200-SMA on the hourly chart at $0.0262 can drive TRX down to $0.0258 and even $0.0255
