- Tron price must breakout above the upper tip of a ascending parallel channel to confirm a bullish breakout.
- TRX needs to flip 200 SMA into support to re-start the bullish leg.
- MACD and RSI technical indicators confirm Tron’s bullish narrative.
The Tron price has displayed a sluggish price action over the last 10 days after an approximately 100% rally from the July 20 low at $0.048 to the August 16 at $0.098. This rally was followed by a 15% declined to the current price at $0.083. That said, Tron needs support from the wider market to re-start the uptrend.
If you are wondering how to buy TRX cheap at the moment, please read on.
Tron Price Displays A Sideways Price Action
TRX has been displaying a sideways price action and appears to have formed a rectangle pattern between $0.082 and $0.091 on the daily chart. Note that the rectangle pattern does not have defined bullish or bearish breakout, but breaking above the upper boundary of the rectangle around $0.091 will predict a bullish move for Tron.
At the time of writing Tron is exchanging hands in the red at $0.083 and appears to be battling immediate resistance at $0.086 embraced by the middle boundary of the rectangle pattern. For a bullish move to be confirmed, the TRX price must close the day above this level and go above the middle boundary of the rectangle.
A clear bullish breakout will be confirmed if TRON rallies above the rectangle towards the August 16 high at $0.098, coinciding with the upper tip of the ascending channel.
TRX/USD Daily Chart
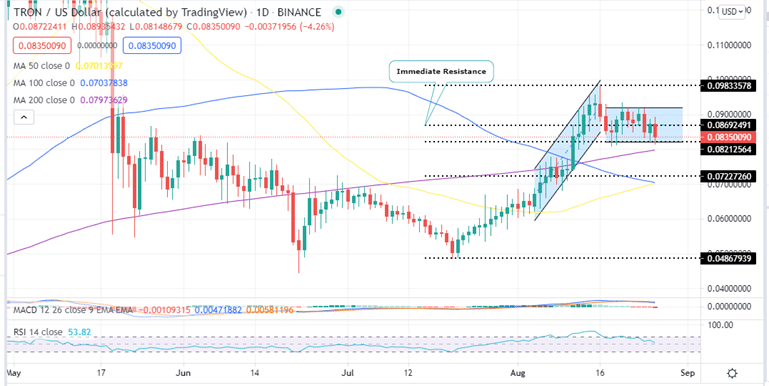
The $0.082 Mark Crucial For Tron Price’s Bearish Breakout
Note that a breakout below the $0.082 mark embraced by the lower boundary of the rectangle will confirm the continuation of the bearish leg. If this happens, TRX price will break below the lower boundary of the rectangle towards the range low at $0.0801. A decisive bearish breakout will be achieved if TRX goes below the $0.080 psychological embraced by the 200-day simple moving average (SMA) to bring the $0.072 support level into play.
The Moving Average Convergence Divergence (MACD) and the Relative Strength Index (RSI) indicators validate the bearish narrative. The MACD’s movement below the signal and the downward movement of the RSI away from the oversold zone are all bearish crypto signals.
Where To Buy TRX Now?
The top exchanges for trading in Tron cheap currently are: eToro, FTX, Binance and Coinbase. You can find others listed on our crypto exchanges page.
Looking to buy or trade Tron now? Invest at eToro!
Capital at risk
