- TRON price has reversed from bearish to bullish on the four-hour chart
- The RSI confirms the current bullish outlook
TRON price turns green as bulls attempt to keep it above the 0.055 psychological level. This after TRX came under heavy bearish pressure that started on July 07 following a bearish that occurred on July 06. This happened when the 20-day Simple Moving Average crossed below the 50-day SMA. Tron attempted to reverse the trend on July 09, but the bullish outlook was overturned by the appearance of another death cross on July 10 when the 50-day SMA crossed below the 100-day SMA.
TRX has been on a spiral downwards as any attempts to overturn turn the Tron price action upwards failed. Currently, Tron teeters around $0.057 representing a 19% decline from the June 29 high of $0.070.
Let’s look at what is likely to happen to the Tron Price.
TRON Price Faces Resistance from the 20-day SMA
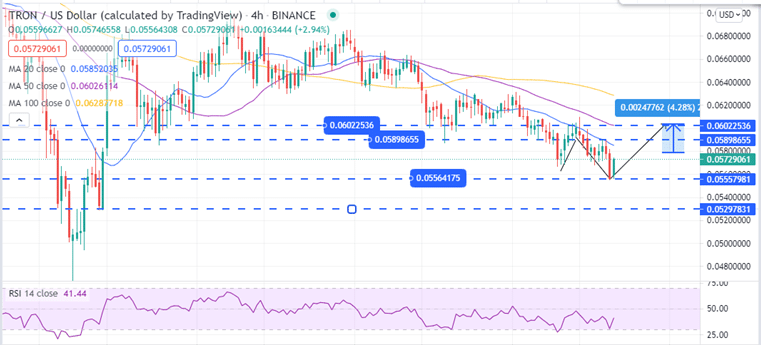
On July 05, Tron flipped the 20-day SMA from support to resistance and dropped from $0.068 to its current price. Since then, TRX has spent most time trading below the 20-day SMA as seen on the four-hour chart. A bullish rally that began on July 14 was rejected by the 20-day SMA as bears managed to pull the price back to areas below this level. Overhead pressure has since seen Tron price fall to areas around $0.055.
However, the appearance of a bullish inside bar at the end of the 4-hour chart sends a positive crypto signal that buyers might be rallying to reverse the downward trend. If this happens, TRX might rise to areas around $0.058.
Bulls will need to overcome the 20-day SMA resistance and the resistance at $0.0589 to reclaim the 0.060 support level, a 4% rise from the current price. This area is currently defined by the 50-day SMA.
The Relative Strength Index (RSI) supports this bullish outlook. This momentum indicator measures the extent to which the recent Tron price changes to evaluate whether it is in an uptrend or down trend. The 4-hour chart shows that the RSI is currently above 30 and its shot upwards hints at a bullish TRX.
TRON Price (TRX/USD) Chart
Looking Over the Fence
On the flip side, failure to close the day above $0.058 level will mean that the bears are more powerful and that the bearish run is sent to continue. If this happens, Tron is likely to revisit the resistance level around $0.053, an area that TRX explored in June 24.
Failure to hold this support might push the Tron price downwards towards the June 22 lows around $0.046.
- If you are a new crypto trader, read our detailed guide on the best cryptocurrency to buy as a start.
Looking to buy or trade Tron now? Invest at eToro!
Capital at risk
