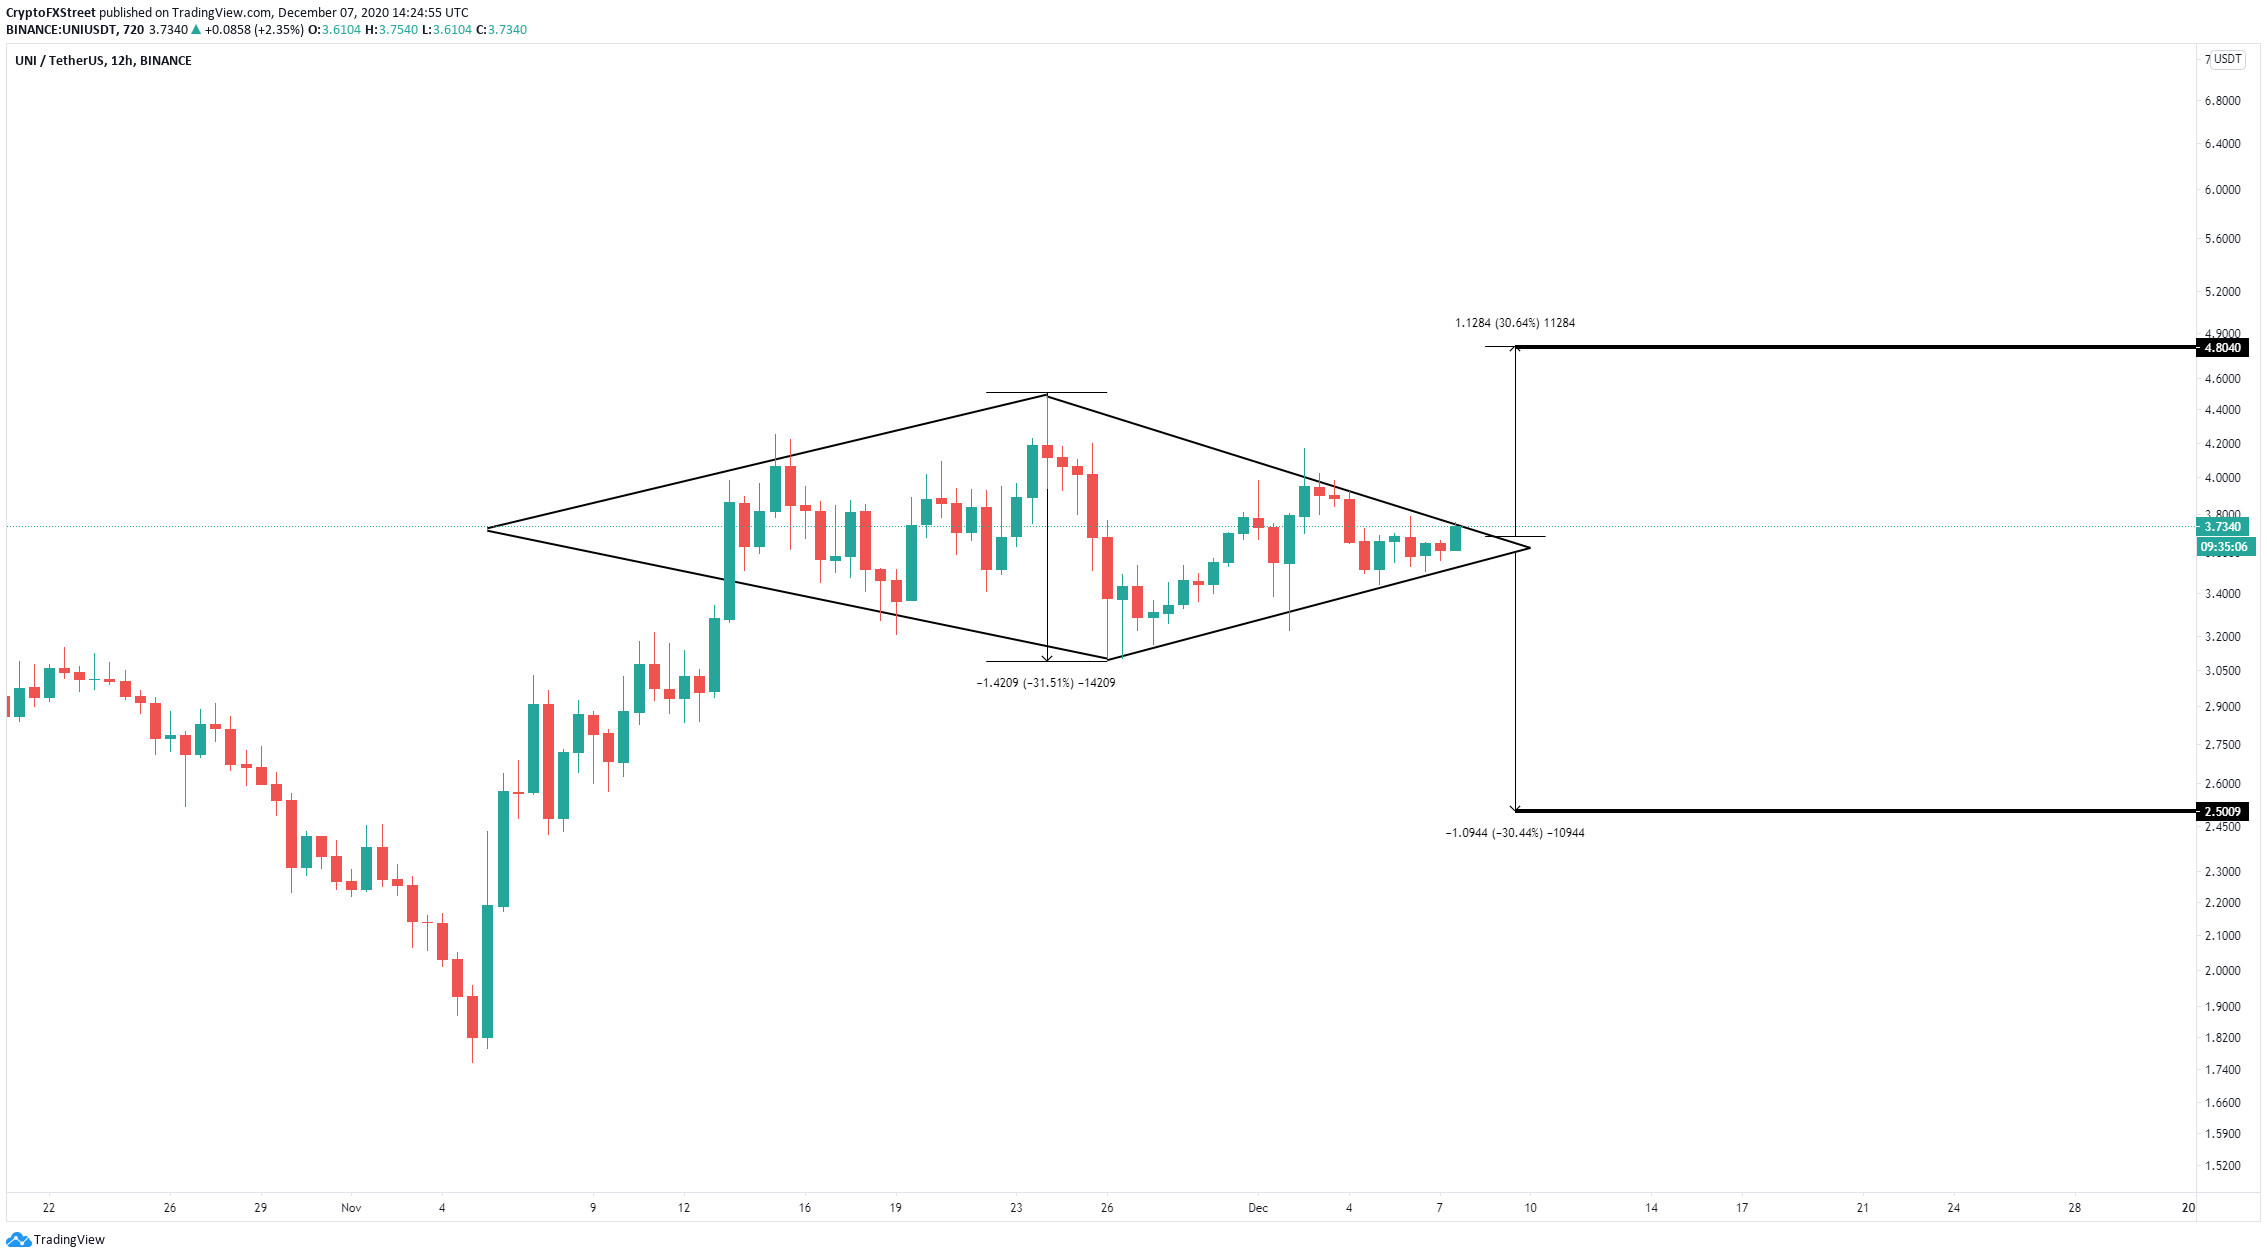
- Uniswap price is bounded inside a diamond top pattern on the 12-hour chart.
- Although UNI could be on the verge of a bearish reversal, the bullish outlook cannot be overlooked.
UNI is trading at $3.72 at the time of writing and it is contained inside a diamond top pattern on the 12-hour chart, a bearish indicator that usually shows the beginning of a reversal. However, given the current DeFi bullish momentum, it is entirely possible for Uniswap price to breakout.
Uniswap price faces two key levels before a breakdown or breakout
UNI is trading inside a diamond top pattern on the 12-hour chart, and it is on the verge of a breakout or breakdown. The lower trendline is established at $3.55, which means that a breakdown below this level would quickly push Uniswap price towards $2.5, a 30% move.
UNI/USD 12-hour chart
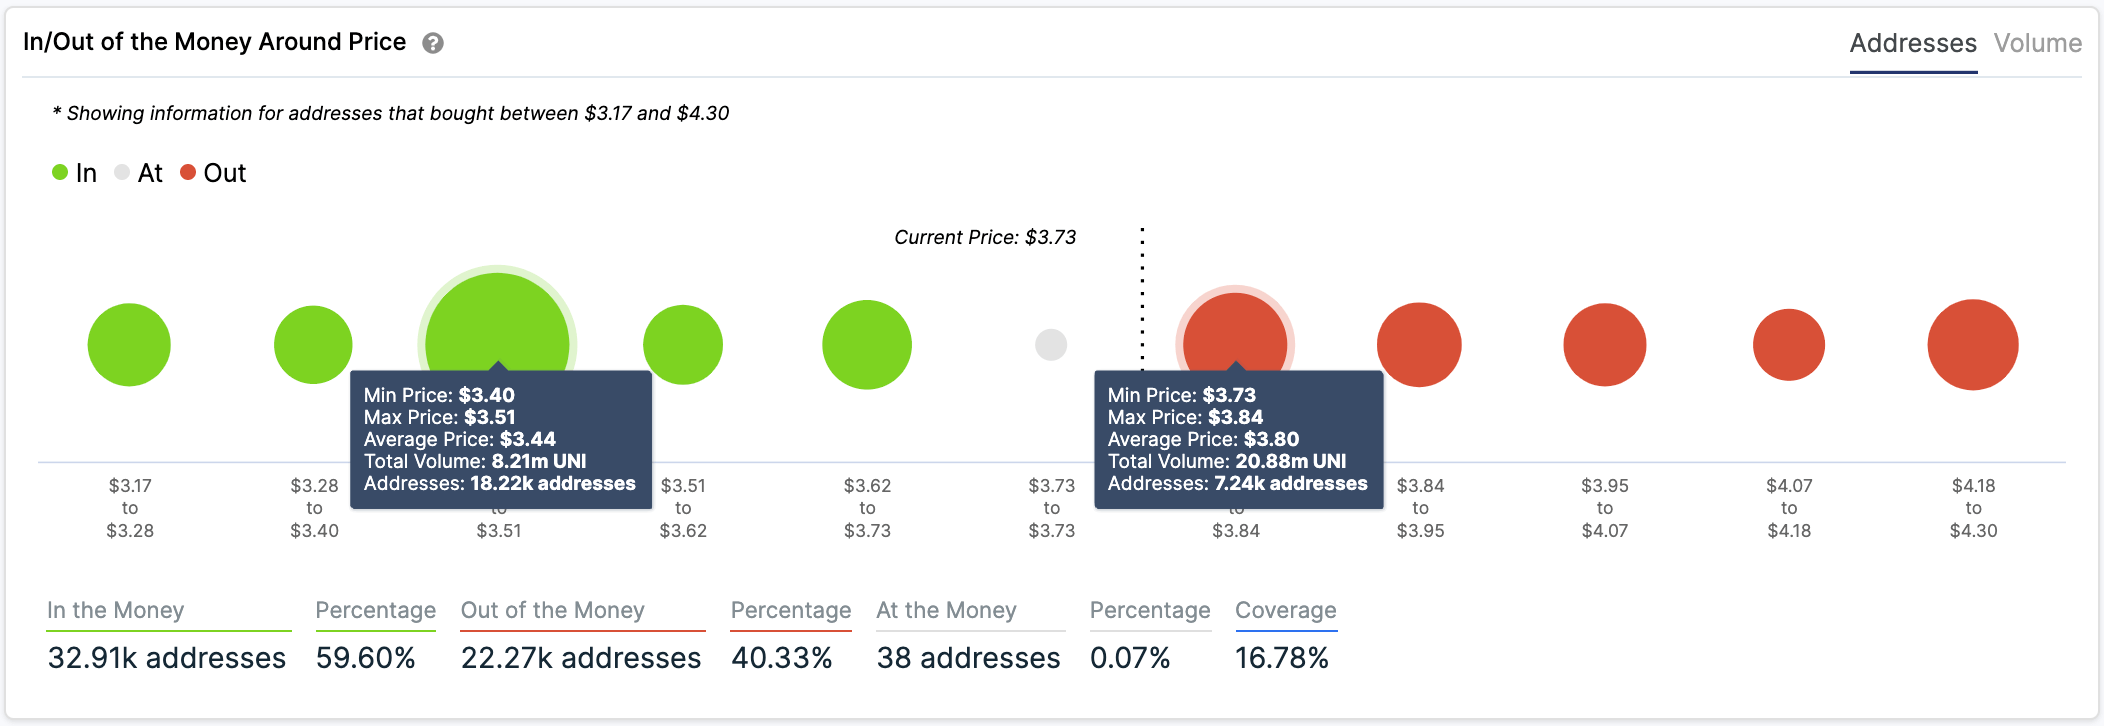
This seems to coincide with what the In/Out of the Money Around Price (IOMAP) chart shows, a substantial support area between $3.4 and $3.52 but almost nothing below these levels.
UNI IOMAP chart
On the other hand, the most significant resistance range is located between $3.73 and $3.84, where 7,240 addresses purchased 20.88 million UNI tokens. This area also coincides with the upper trendline of the diamond pattern. A breakout above this point would drive Uniswap price towards a price target of $4.8.


