- Uniswap’s technical picture worsens after breaking below the 100 SMA support.
- A symmetrical triangle could see UNI fall by 74% from the prevailing market value.
- Whales are contributing to the increasing selling pressure as they uncontrollably offload their bags.
- The 200 SMA support on the 4-hour chart is likely to prevent massive losses.
Uniswap has hit another barrier at $28, cutting short the recovery staged from $18. The mission to gain ground to the all-time high of around $34 has been abandoned, with losses extending toward $20. UNI is trading at $22 after losing a couple of key support zones, likely to flip into intense seller congestion areas.
Uniswap on the brink of a colossal breakdown
Uniswap is among the leading decentralized finance (DeFi) tokens in the market. The project boasts of a value locked of $3.98, making it the fourth-largest DeFi platform.
Meanwhile, losing the 50 Simple Moving Average (SMA) as support triggered losses beneath the tentative 100 SMA on the 4-hour chart. At the time of writing, Uniswap is trading at the apex of a symmetrical triangle pattern.
The technical pattern has no bullish or bearish bias. In other words, it can result in either a breakdown or a breakout. Symmetrical triangle patterns are formed by a series of declining peaks and a set of ascending lows. The peaks and troughs are connected using trendlines. The pattern highlights a period of consolidation.
A breakout occurs above the upper trendline, while a breakdown happens when the price slices through the ascending trendline. Note that these triangles have precise targets, measured from the highest to lowest points. The ongoing Uniswap breakdown has a 74% downward target, around $5.75.
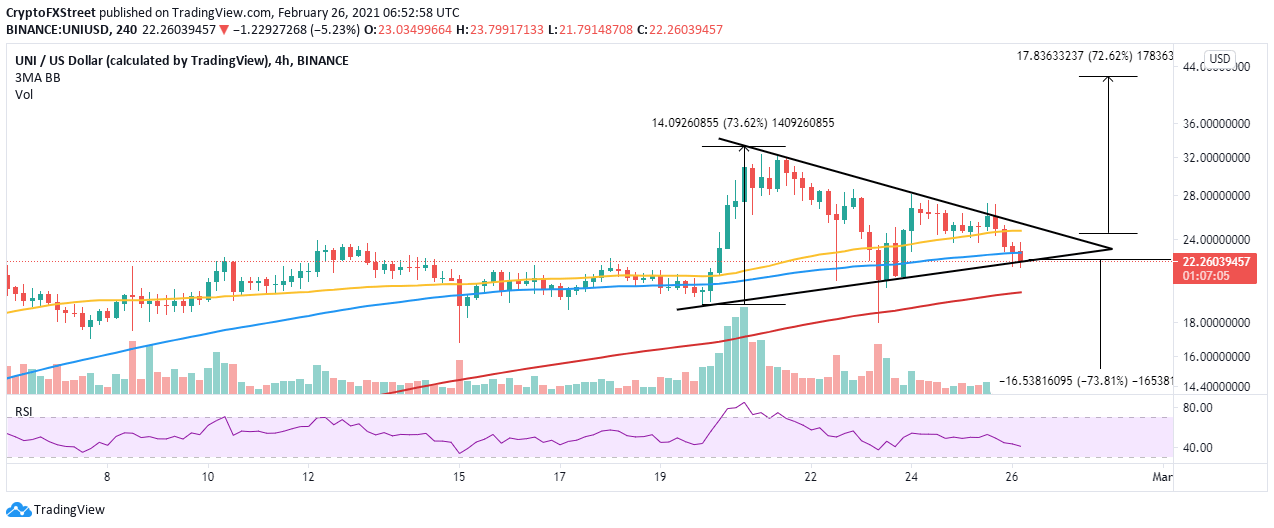
UNI/USD 4-hour chart
According to Santiment’s holder distribution model, Uniswap’s whales are on a selling spree. It seems that a bearish sentiment hovers among the investors who believe that price may fall further and perhaps it is time to take profit.
For instance, addresses holding between 1 million and 10 million UNI topped out at 66 on February 14, tracked on a 30-day trailing average, dropped to 61 at the time of writing, representing a 7.6% decline. The drop may seem insignificant from the face value, but the volume moved is immense and may significantly contribute to the overhead pressure.
%20%5B10.29.28,%2026%20Feb,%202021%5D-637499221265025854.png)
Uniswap holder distribution
Looking at the other side of the picture
The 4-hour chart shows that UNI has broken below the symmetrical triangle, risking a major pullback. However, the 200 SMA currently at $20 is in line to support and perhaps halt the declines.
In addition, earlier in the week, Uniswap found support at $18 which could also play a key role in cushioning the token from the dip. On the upside, closing the day above the 100 SMA will call for more buyers to join the market, validating an uptrend.
