- Uniswap price must breakout above the 100 and 50 SMAs to confirm a bullish breakout.
- A drop below the 200 SMA would push the UNI price towards the $23 mark.
- The short-term price prediction for Uniswap remains neutral as consolidation continues.
The consolidation of the crypto market has been consolidating over the week reflecting a steady market. This could attract buyers to altcoins like Uniswap. Like crypto majors like Bitcoin, the Uniswap price has displayed a sluggish a sluggish price action over the last two weeks. Support from the wider market will be needed to establish the direction that UNI will take in the near future.
At the moment, the UNI/USD price appears to consolidating under the 50 period Simple Moving Average (SMA) at $27.19 after dropping more than 1.15% gains over the last 24 hours.
Uniswap Price Faces Massive Resistance Upwards
UNI has been trading sideways between the 200 SMA at $26.20 and the 50 SMA at 27.19. This sideways price action is characterised by decreased price volatility as defined by the squeezing Bollinger Bands (BB). The price volatility will continue to decrease as the Bollinger Bands squeeze more towards each other, an illustration of indecision in the market.
The horizontal price action is also accentuated by the sideways movement of the Moving Average Convergence Divergence (MACD) indicator at the neutral line. Moreover, the sideways movement of the Relative Strength Index (RSI) shows that the bullish pressure and the bearish pressure are cancelling out as seen on the four-hour chart. Therefore, Uniswap price prediction in the near-term remains neutral.
UNI/USD Four-Hour Chart
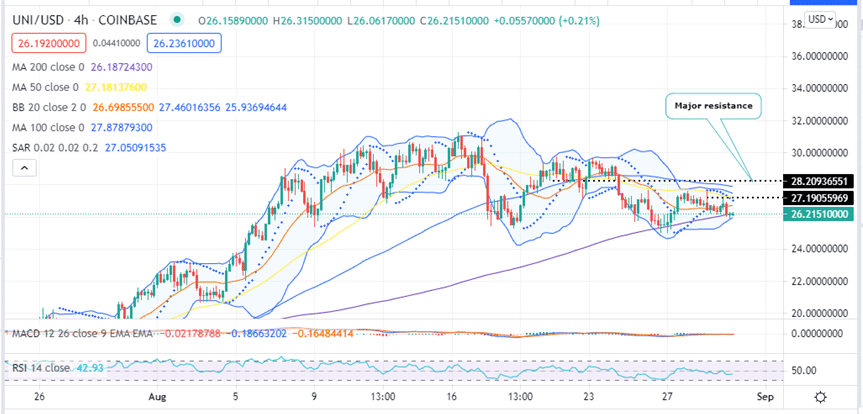
At the time writing UNI is trading at the 200 SMA around $26.21 and seems to be battling resistance at $26.71 embraced by the middle band of the BB.
On August 24, Uniswap price broke below the 100 and 50 SMA’s indicating weakness. On August 27 and 28, the bulls tried to push UNI back above the SMAs but they could not overcome the overhead pressure at these levels.
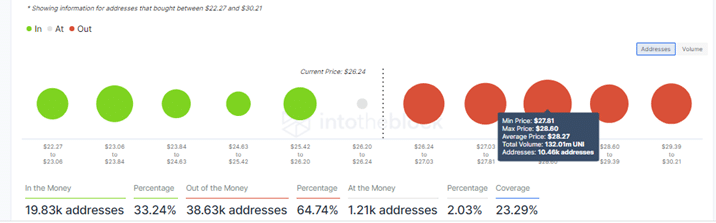
The weakness displayed by the Uniswap price is accentuated by on-chain metrics from the In/Out of the Money Around Price (IOMAP) model by IntoTheBlock. The UNI IOMAP chart indicates the asset faces major hurdles at the $28.20 resistance zone. This zone is within the $27.81 and $28.60 price range where 132.01 million UNI were previously bought by roughly 10,460 addresses. A
Note that pushing the Uniswap price beyond this level could be met by selling pressure from investors who want to collect profits, and particularly those who would wish to break even.
Uniswap IOMAP Chart
Which Way For The Uniswap Price?
The bulls are currently again trying to hold the UNI price above the 200 SMA. If they manage to do that, the Uniswap price could re-test the 100 and 50 SMAs. A decisive bullish breakout will be confirmed if UNI closes the day above the SMAs at the $28 psychological level. If This happens, Uniswap could rally to areas above the $30 psychological level signalling the start of a new uptrend.
On the downside, if the price turns down from the 200 SMA , UNI could drop below the $26 psychological level to re-test the critical support at $23.06.
Where To Buy UNI Now?
The top exchanges for trading in Uniswap currently are: eToro, FTX, Binance and Coinbase. You can find others listed on our crypto exchanges page.
Looking to buy or trade Uniswap now? Invest at eToro!
Capital at risk
