- Uniswap price loses 9% to lows below the $26 level.
- UNI’s upwards trend to be met by several hurdles.
- Uniswap sends multiple bearish signals on the four-hour chart.
Uniswap price prediction is currently bearish after losing 9% over the last 24 hours to trade just above the $26 psychological level. UNI’s market capitalisation has decreased by 8% from $16,296,797,688 to the current value at $15,974,038,554 over the same period. The bearish leg witnessed over the last two days has seen the asset tank towards the immediate support level at $25.5.
At the time of writing, Uniswap is trading in the red at $26.21 as bears focus on stretching losses below the $26 psychological level.
The question that many traders are seeking to be answered is where to buy UNI cheaply at the moment. Well, let’s find out more.
Uniswap Price Bearish Leg To Continue In Near Term
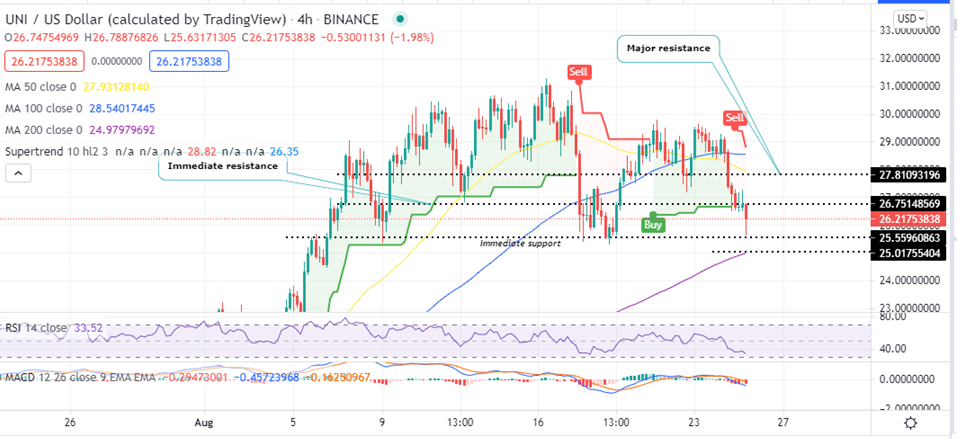
The UNI/USD price prediction for the short-term is significantly bearish. Note that the Uniswap price has sent multiple bearish signals on the four-hour chart. . For example the SuperTrend Indicator which changed from greed to red yesterday and flipped above the price, sent a call to sell signal. Note that as long as the SuperTrend moves above UNI price, the bearish leg will continue.
Also note that the Moving Average Convergence Divergence (MACD) indicator sent a bearish signal on the same four-hour chart. This happened yesterday August 24 when the MACD line (blue) crossed below the signal line (orange) and tanked below the zero line. Realise that as long as the MACD continues to move below the zero line in the negative region, the UNI bearish bias will remain.
Moreover, the downward movement of the Relative Strength Index (RSI) currently at 34 illustrates that bears are tightening their grip on Uniswap.
UNI/USD Four-Hour Chart
In addition to technical indicators, On-chain metrics from In/Out of the Money Around Price (IOMAP) model by IntoTheBlock’s indicate that UNI’s immediate resistance embraced by the 50 period Simple Moving Average (SMA) around $27.84 is significant enough to curtail any attempts to push Uniswap price upwards. It belongs to the $27.63 and $28.43 cluster of 10,000 addresses who previously bought approximately 224.3 million UNI. These investors might want to breakeven at this point preventing any further upwards movement of Uniswap.
Uniswap IOMAP Chart
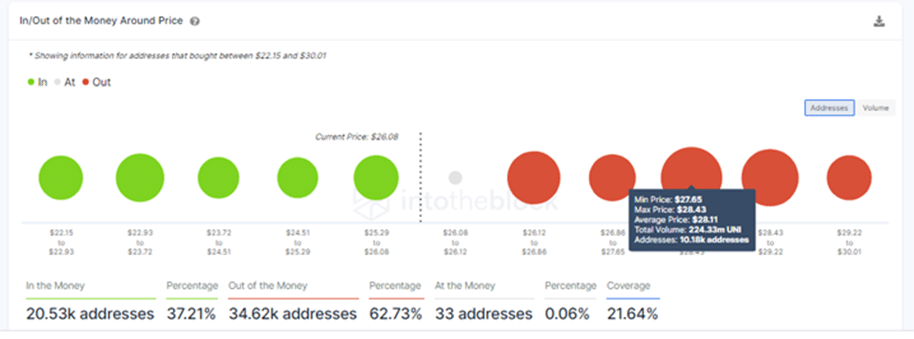
In comparison, the immediate support at $25.55 it is within the $25.29 and $26.08 price range where 14,320 addresses previously bought 1.53 million UNI. This support is not robust enough to absorb the persistent selling pressure that the presently being witnessed.
A Look at the Day Ahead for the Uniswap Price
One of the key levels to watch for the day ahead is the $25.55 support level. If UNI closes the session below this level it will indicate that the bears are still in control of the Uniswap price and the next key level to watch would be the 200 SMA at $25.
On upside, a session closure above the $26 psychological level would be an indication that the bullish leg will be re-started. The bullish momentum will be fully confirmed if the UNI price breaks out above the major resistance at $27.18.
Where to buy UNI Cheap Now
The top exchanges for trading in UNI currently are: eToro, Bittrex and Binance. You can find others listed on our crypto exchanges page.
Looking to buy or trade crypto now? Invest at eToro!
Capital at risk
