- US Dollar Index (DXY) declines to the May’s lows on market risk-on mood.
- Support can emerge near the 99.00/98.80 price zone.
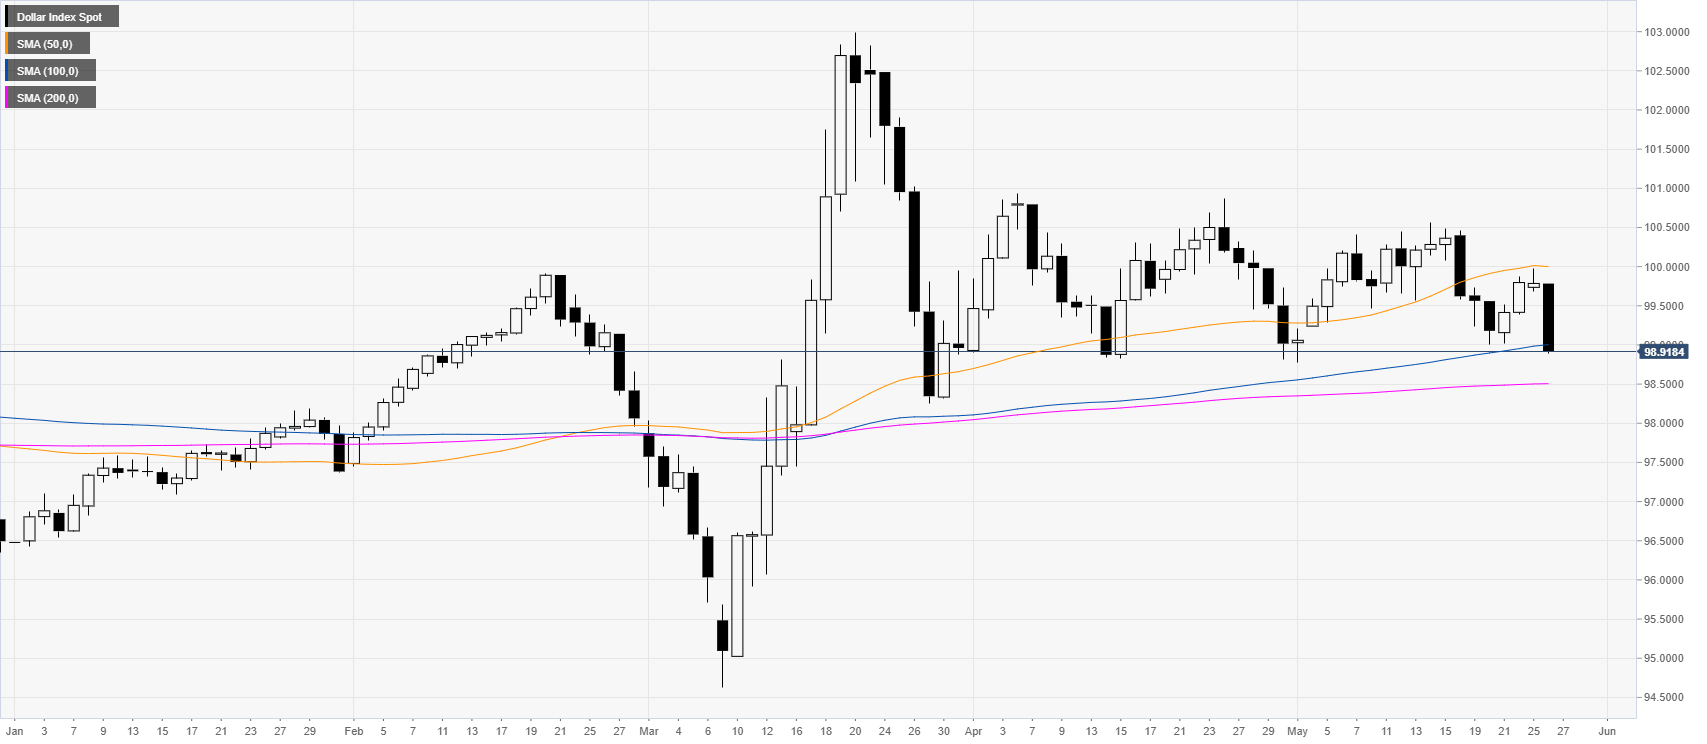
DXY daily chart
The US Dollar Index (DXY) shoots lower to the 99.00 level and the 100 SMA on the daily chart. The index is challenging the May’s lows as risk appetite on Wall Street decreases the demand for the greenback.
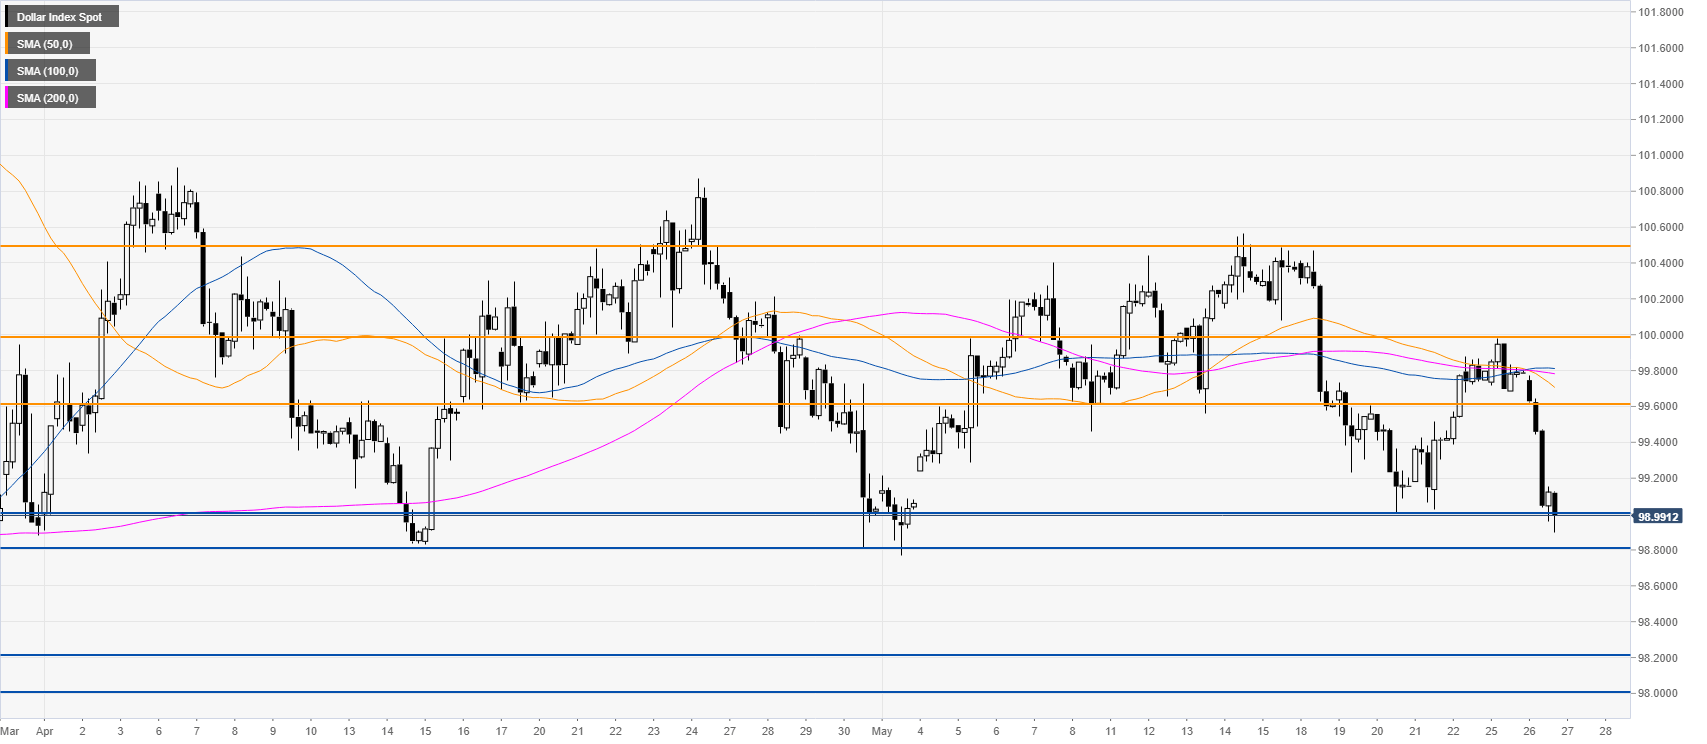
DXY four-hour chart
DXY is challenging the May’s lows while trading below the main SMAs on the four-hour chart. Bulls will be attempting to support the market in the 99.00/98.80 price zone as it proved solid support in the last few months. On the other hand, a sustained break below the mentioned levels can lead to an extension down towards the 98.20/98.00 support level.
Additional key levels
