- US dollar index (DXY) is easing down just below the 100.00 mark.
- Support can emerge near the 99.50 and 99.00 levels.
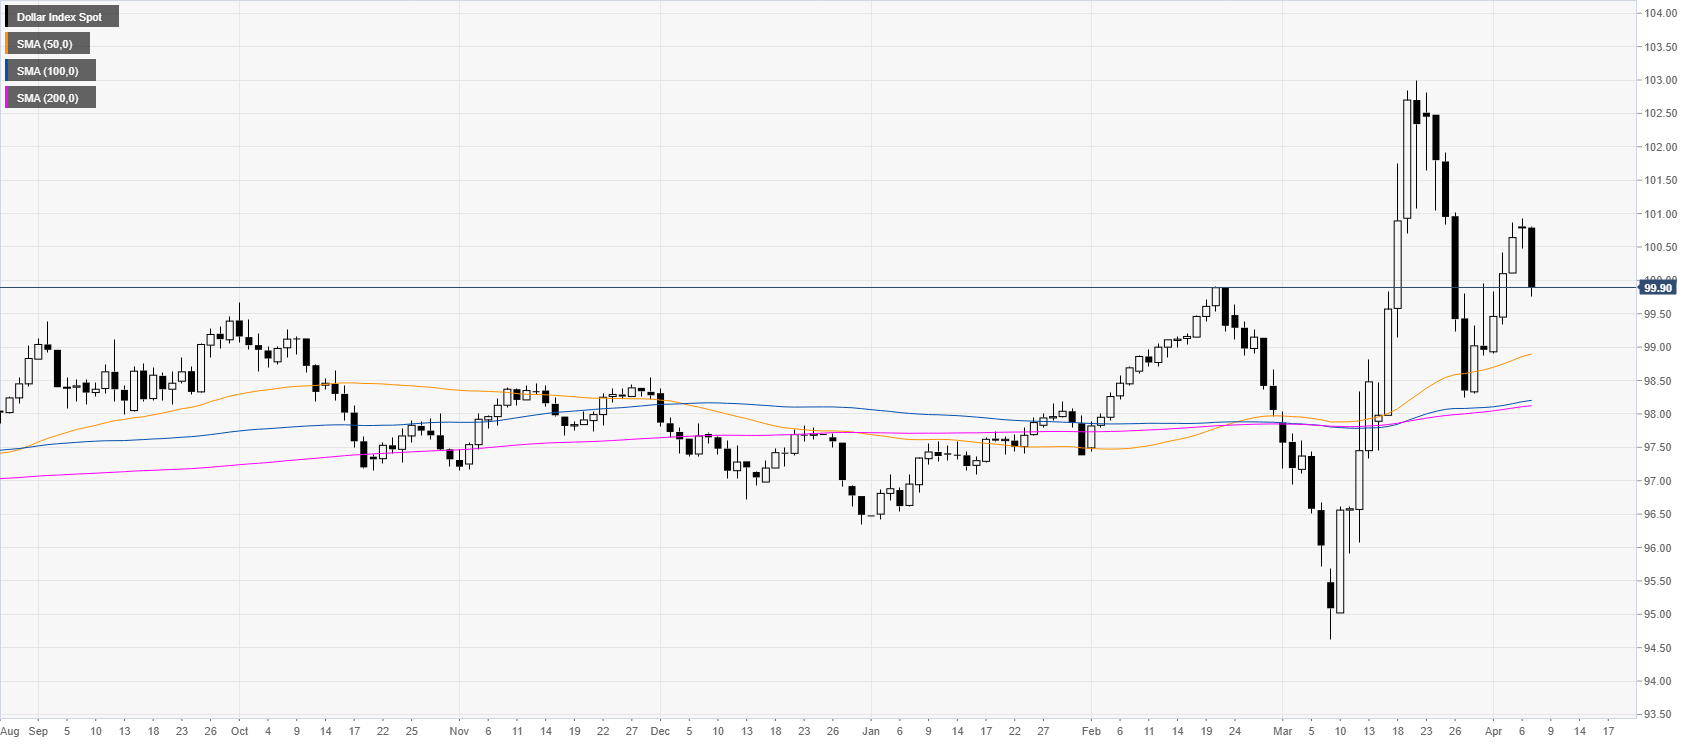
DXY daily chart
DXY is trading in an uptrend above the main daily SMAs as the greenback is trading in two-day’s lows below the 100.00 psychological mark.
DXY four-hour chart
DXY is trading above its 50/200 SMAs on the four-hour chart suggesting a bullish bias in the medium term, however, bulls need to regain the 101.00 figure in order to resume the uptrend towards the 101.50 level. On the flip side, the market could find support near the 99.50 and 99.00 price levels on the way down.
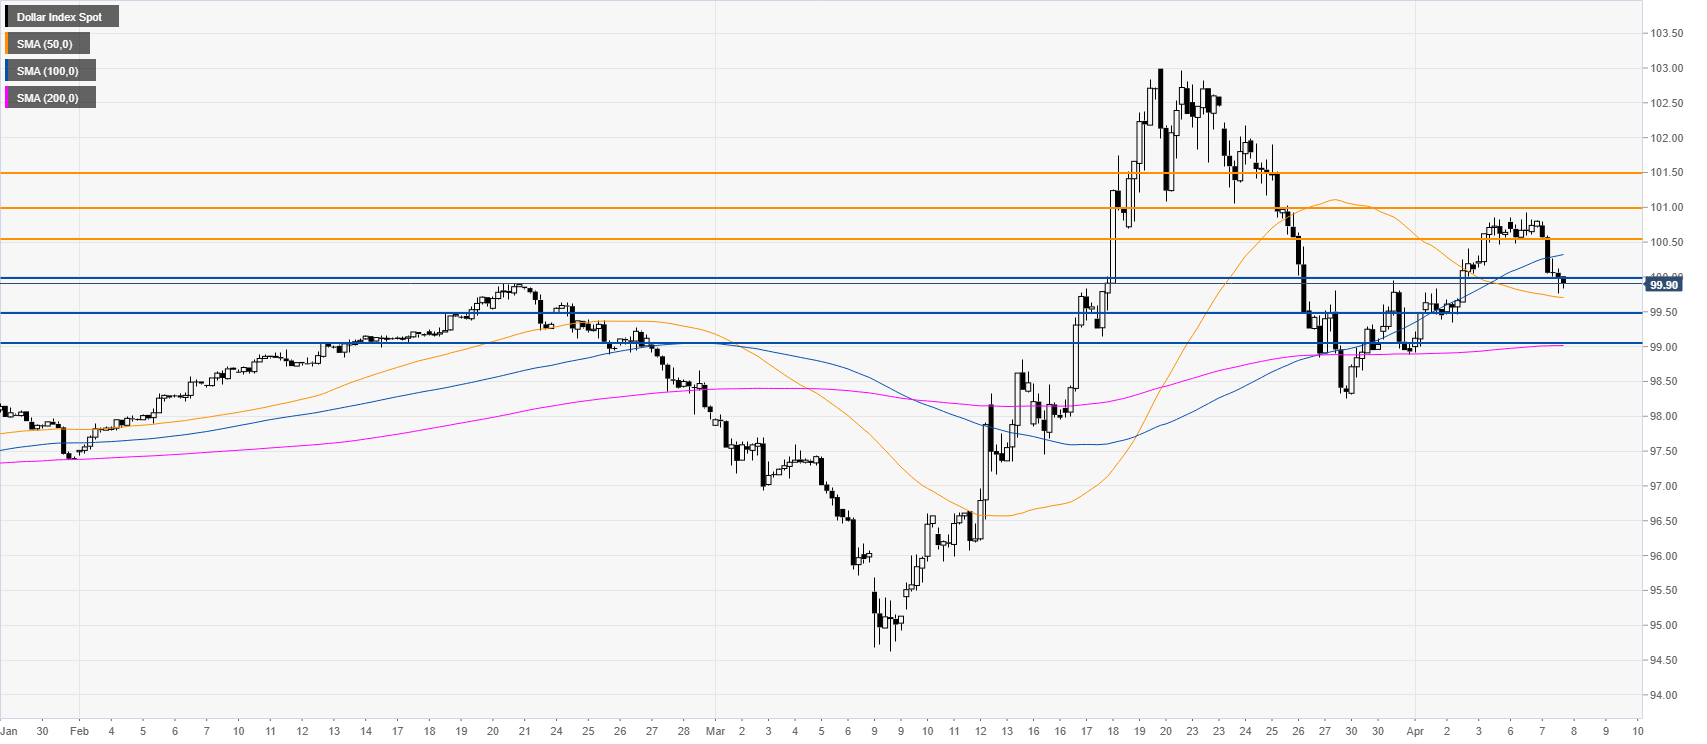
Additional key levels
