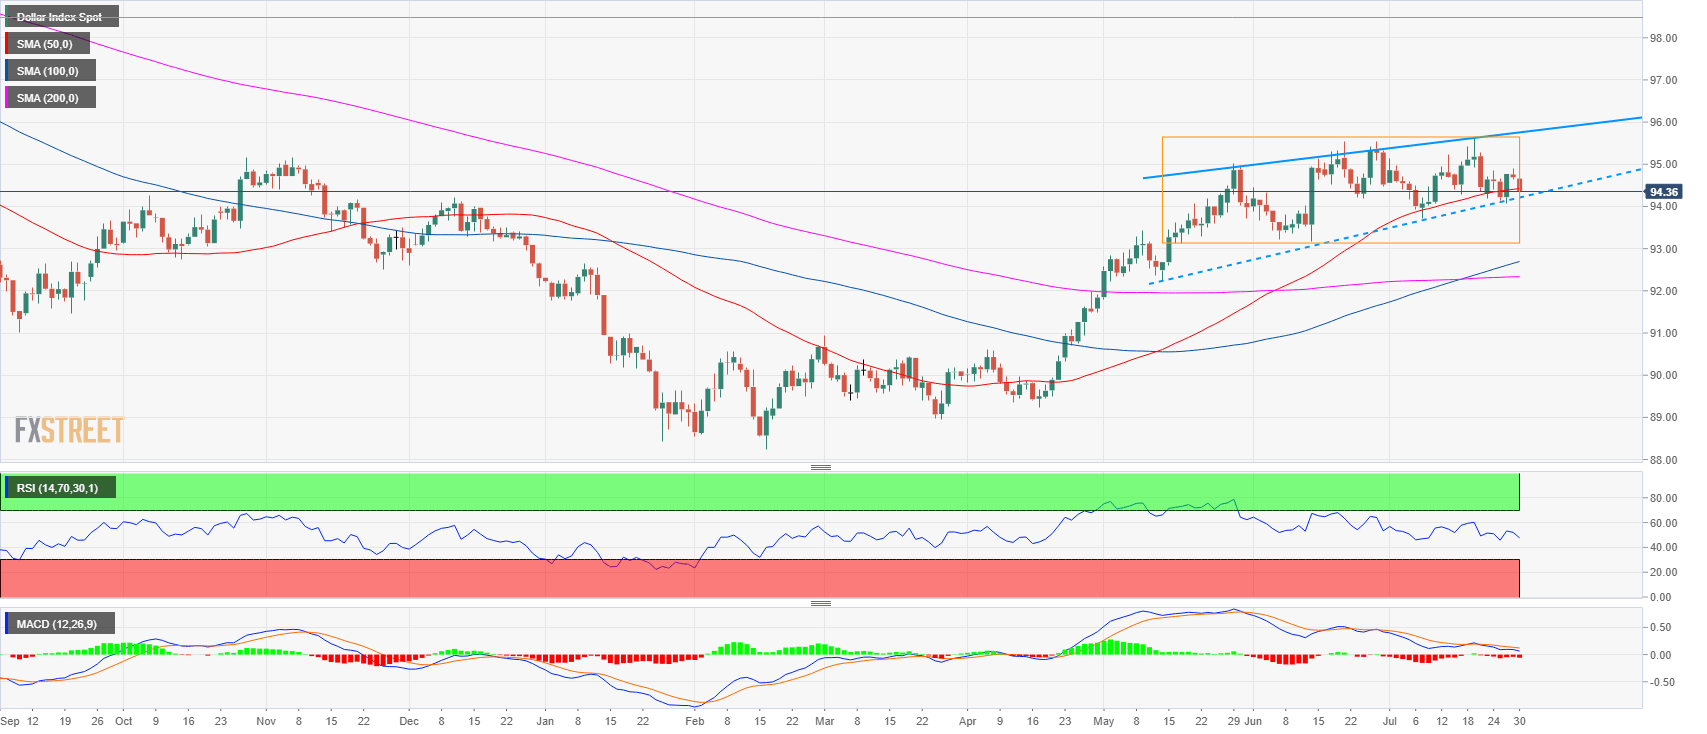
- The US Dollar Index (DXY) has been essentially trading in a range since mid-May (orange rectangle). DXY is holding above a trendline from May 14 and near the 50-period simple moving average (daily).
- As DXY is evolving in rising wedge (daily chart), the bullish structure is slowly weakening and a bear breakout below 94.08 and 93.71 could lead to a drop towards 92.24, May 14 low.
- On the other hand, if bulls manage to keep DXY above 94.08 they would need to overcome 94.91 and 95.24 July 13 high.
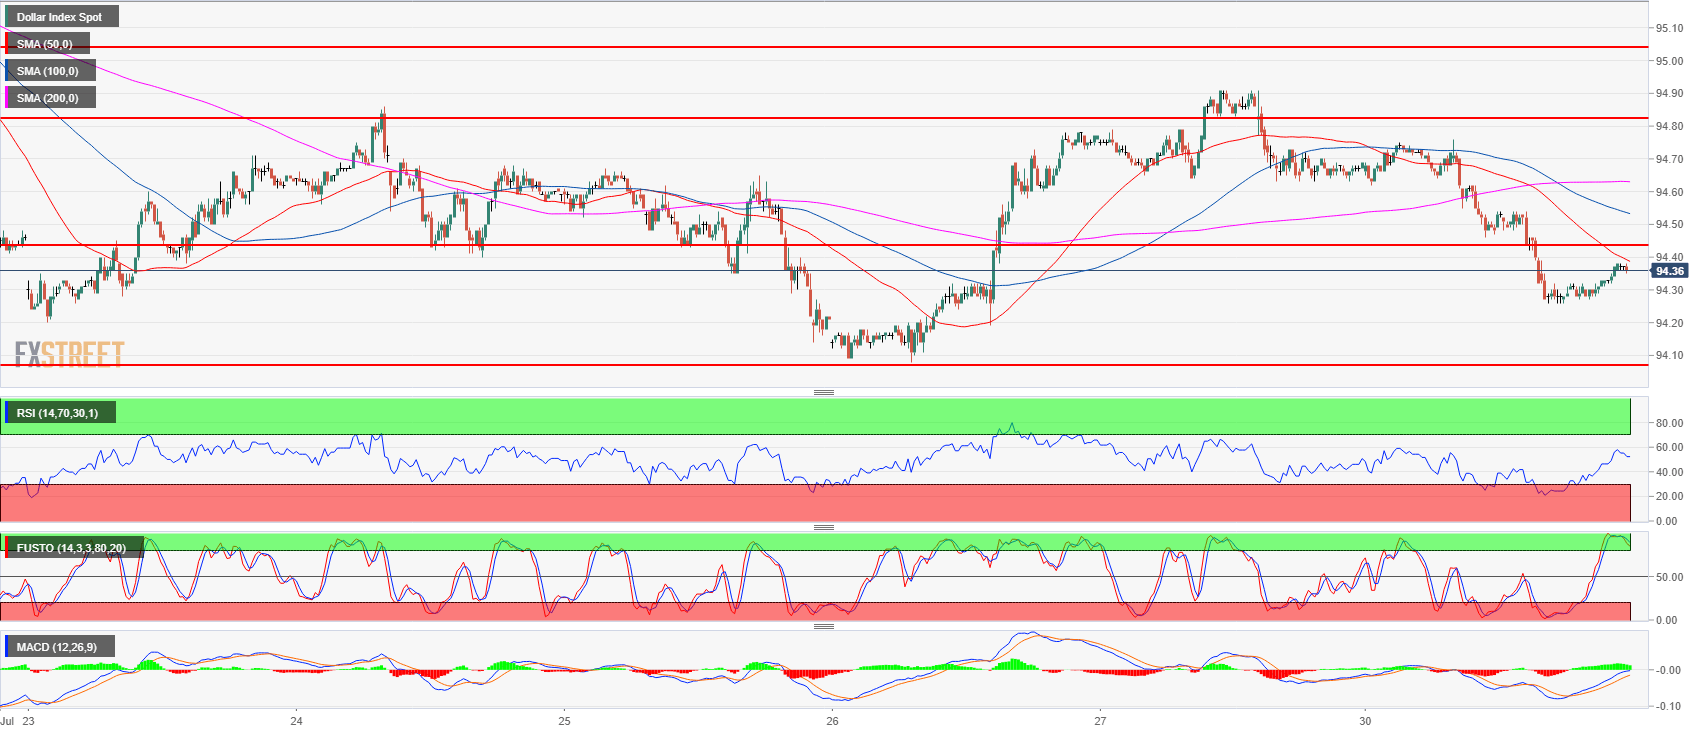
DXY 15-minute chart
DXY daily chart
Spot rate: 94.36
Relative change: -0.32%
High: 94.76
Low: 94.26
Trend: Neutral
Resistance 1: 94.44 June 1, swing high
Resistance 2: 94.83 May 29 close
Resistance 3: 94.91 July 27 swing high
Resistance 4: 95.24 July 13 high
Resistance 5: 95.65 current 2018 high
Resistance 6: 96.00 figure
Resistance 7: 96.51 July 05, 2017
Support 1: 94.08 July 26 swing low
Support 2: 93.71 July 9 swing low
Support 3: 92.24 May 14 low
