- DXY keeps the upside momentum above the 100.00 mark.
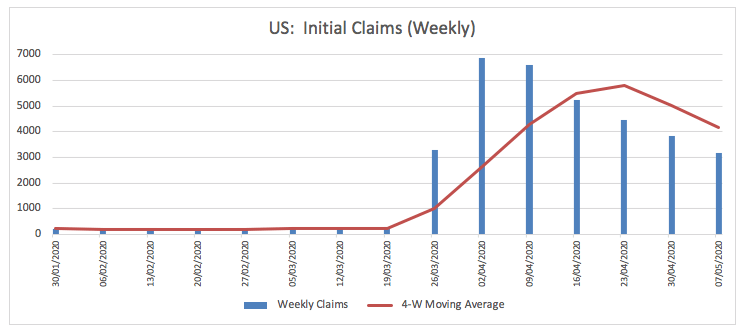
- US Initial Claims rose by nearly 3.2 million last week.
- Focus has now shifted to Non-farm Payrolls due on Friday.
The greenback, when measured by the US Dollar Index (DXY), keeps the buying interest intact so far this week and is now navigating the upper end of the weekly range near 100.30.
US Dollar Index now looks to payrolls
The index is keeps consolidating the recent breakout of the 100.00 barrier on Thursday against the backdrop of the prevailing side-lined mood in the global markets.
As usual in the last sessions, investors continue to gauge the developments from the coronavirus vs. the expected re-opening of the economy, as many US states are already unveiling plans to resume the dormant activity.
In the US data space, weekly Claims were once again in the limelight after nearly 3.2 million US citizens applied for unemployment insurance benefits during last week, so far totalling nearly 33.5 million since late March.
Moving forward and following the ADP report and weekly Claims, all the attention should now shift to April’s Non-farm Payrolls and the unemployment rate (Friday), expected at -22 million and 16.0%, respectively.
What to look for around USD
The better note in the greenback pushed the index back above the 100.00 mark earlier in the week, prolonging the weekly recovery from Monday’s lows. In the meantime, investors have now shifted the attention to the US-China trade war, while the country keeps planning the gradual re-opening of the economy. Supporting the momentum around the greenback emerges the current “flight-to-safety” environment, helped by its status of “global reserve currency” and store of value. On another front, and following the FOMC event, the Fed is expected to stay on the loose end of the monetary policy stance, at least until the coronavirus crisis abates.
US Dollar Index relevant levels
At the moment, the index is gaining 0.11% at 100.28 and a break above 100.31 (weekly/monthly high May 7) would open the door to 100.49 (78.6% Fibo of the 2017-2018 drop) and finally 100.93 (weekly/monthly high Apr.6). On the downside, the next support is located at 98.57 (weekly low May 4) followed by 98.37 (200-day SMA) and then 97.87 (61.8% Fibo of the 2017-2018 drop).
