- DXY stays depressed, refrains to recover after the heaviest drop in 2021.
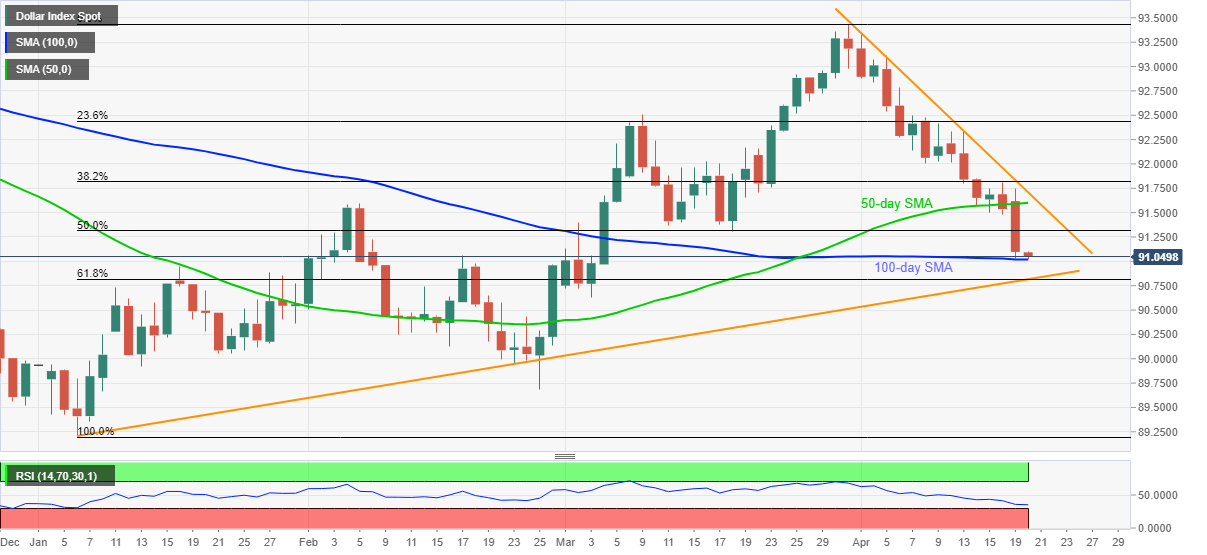
- Confluence of ascending trend line from early January, 61.8% Fibonacci retracement offers the key support below 100-day SMA.
- Buyers may resistance entries below the monthly resistance line.
US dollar index (DXY) remains offered around the lowest since March 04 while declining to 91.02, down 0.06% intraday, amid early Tuesday.
In doing so, the greenback gauge refreshes the multi-day bottom while staying pressured after positing the heaviest losses in the current year.
Although sustained break below 50-day SMA keeps DXY bears hopeful, 100-day SMA tests the sellers around 91.00.
Even if the US dollar gauge drops below the 91.00 threshold, a convergence of the medium-term rising trend line and 61.8% Fibonacci retracement of January-March upside, near 90.80 will be the tough nut to crack for DXY sellers.
Alternatively, the corrective pullback may eye the 50% Fibonacci retracement level of 91.31 but the bulls are less likely to get convinced until witnessing a clear break of a downward sloping resistance line from March 31, around 91.70.
During the consolidation moves, a 50-day SMA of 91.60 will act as an extra filter to the north.
DXY daily chart
Trend: Corrective pullback expected
