- DXY is about to end the year virtually unchanged a handfull of pips up compared to 12 months ago.
- The level to beat for sellers is the 96.70 support.
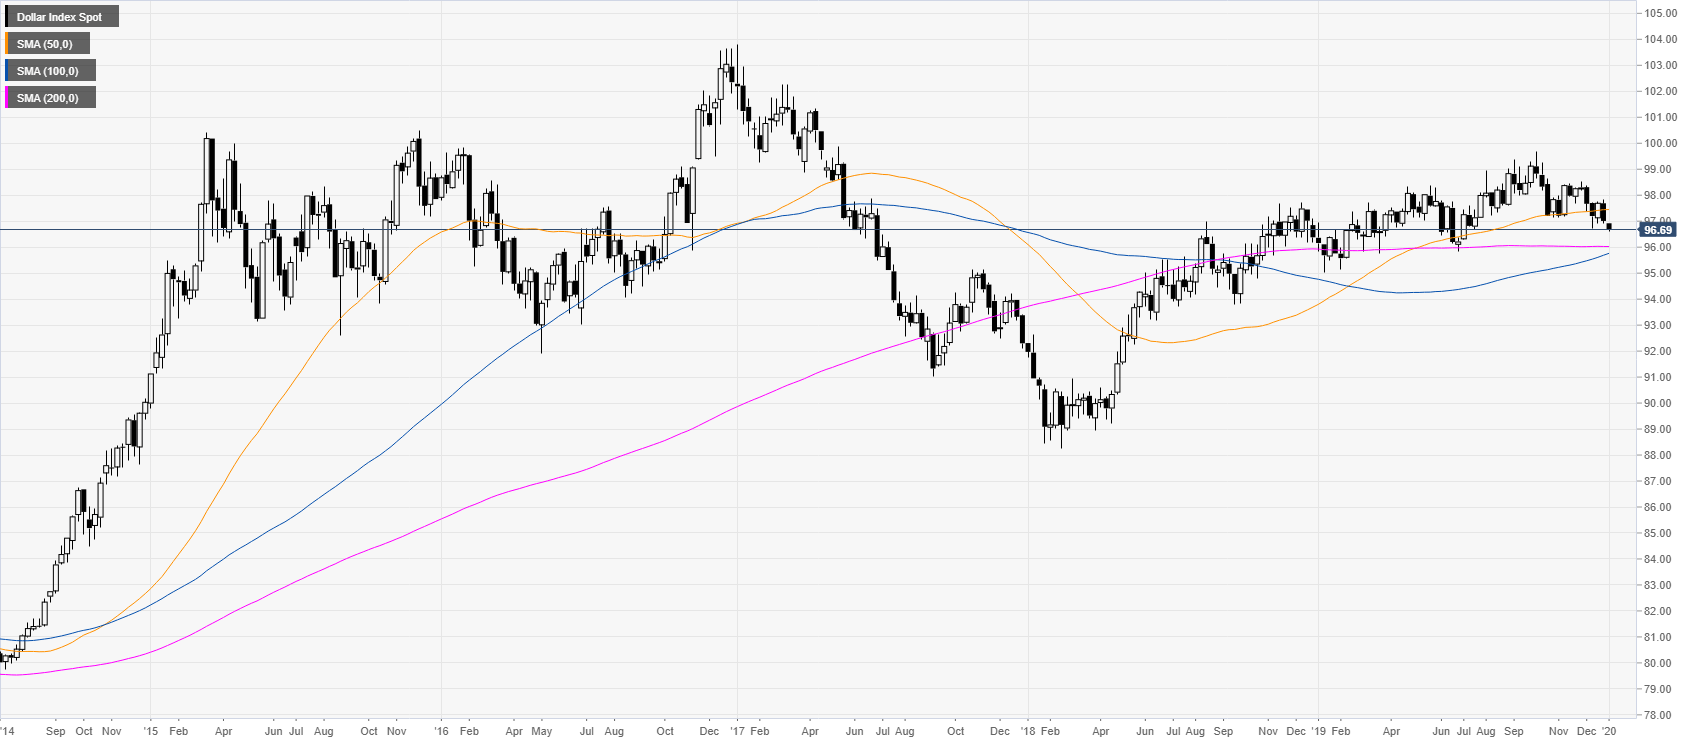
DXY weekly chart
DXY (US Dollar Index) is about to end the year a handful of ticks from where it started at 96.36 in January 2019.
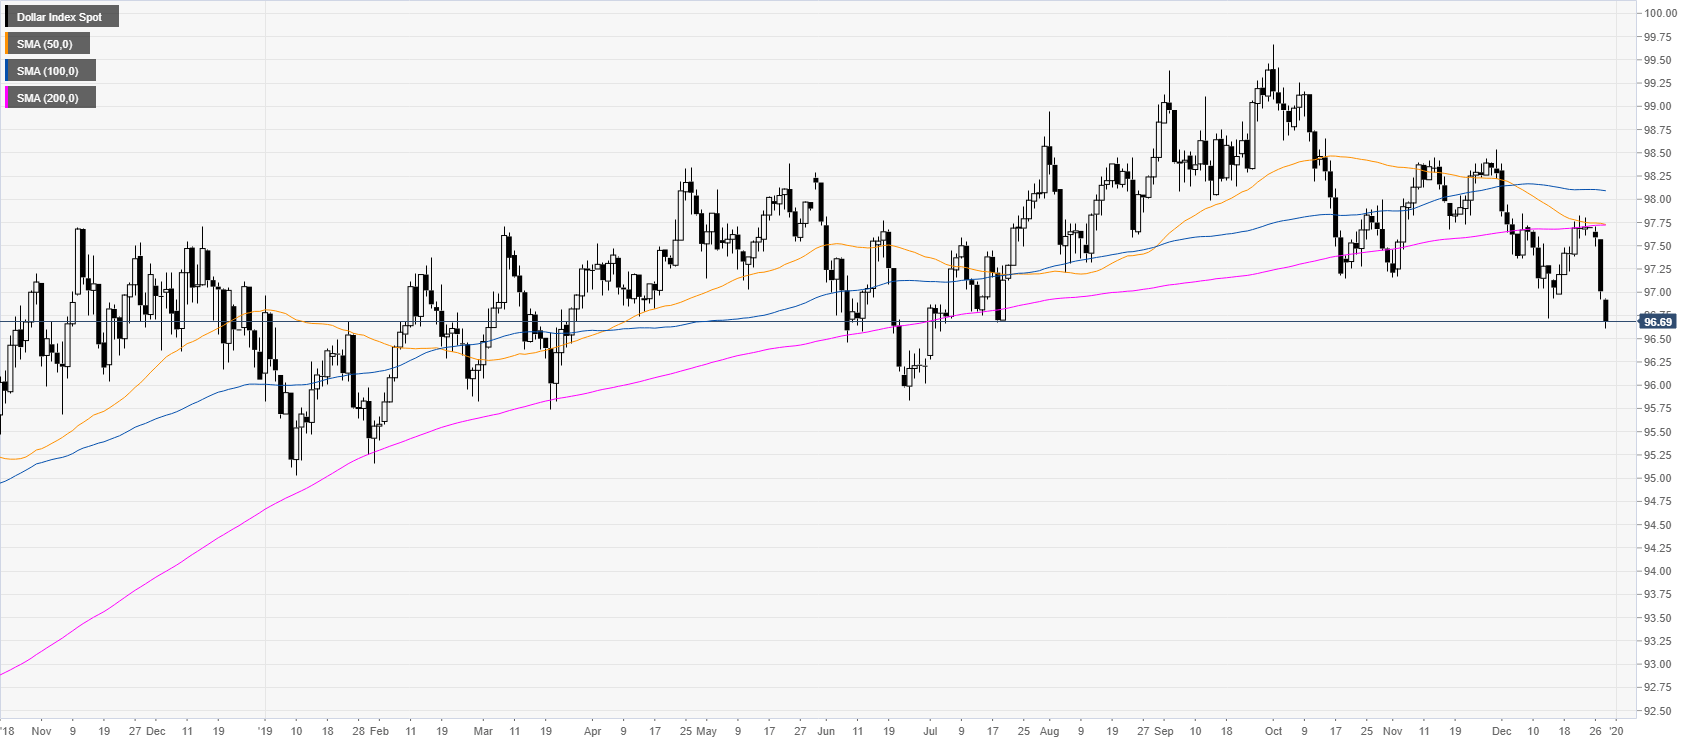
DXY daily chart
The greenback is trading at its lowest since July while below the critical 200-day simple moving average (DMA). If the bulls fail to reclaim the 98.00 handle, 2020 is likely to be a down year for the greenback.
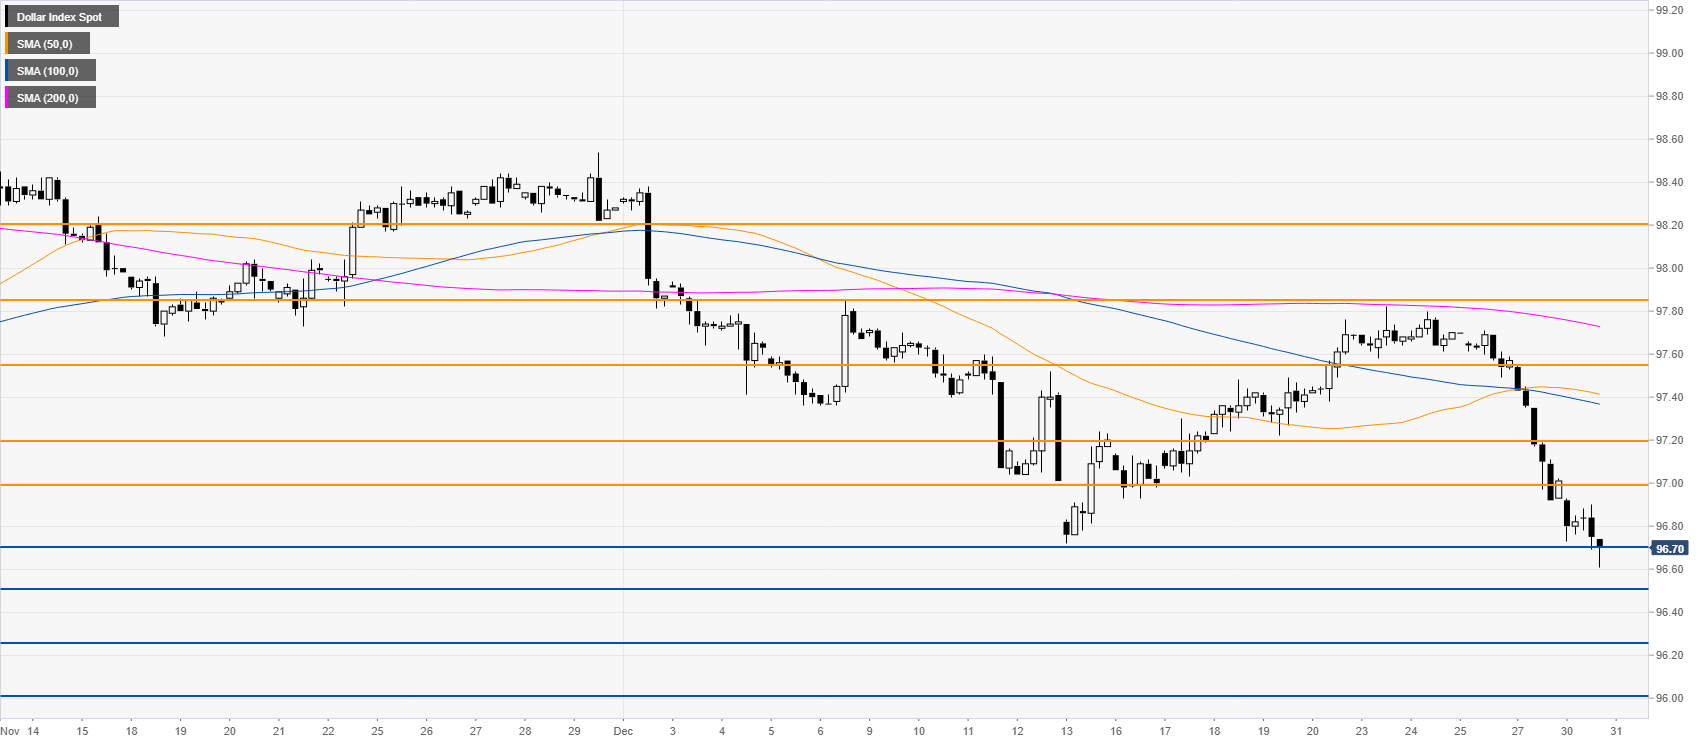
DXY four-hour chart
The market is pressuring the December lows while below the main SMAs. A daily close below 96.70 could lead to further losses towards 96.50, 96.25 and the 96.00 handle. On the flip side, resistance can be located at 97.00, 97.20 and the 97.55 level.
Additional key level
