- US dollar index picks up bids after clearing short-term key resistance line, 200-HMA.
- MACD dwindles on the way to key Fibonacci retracement levels.
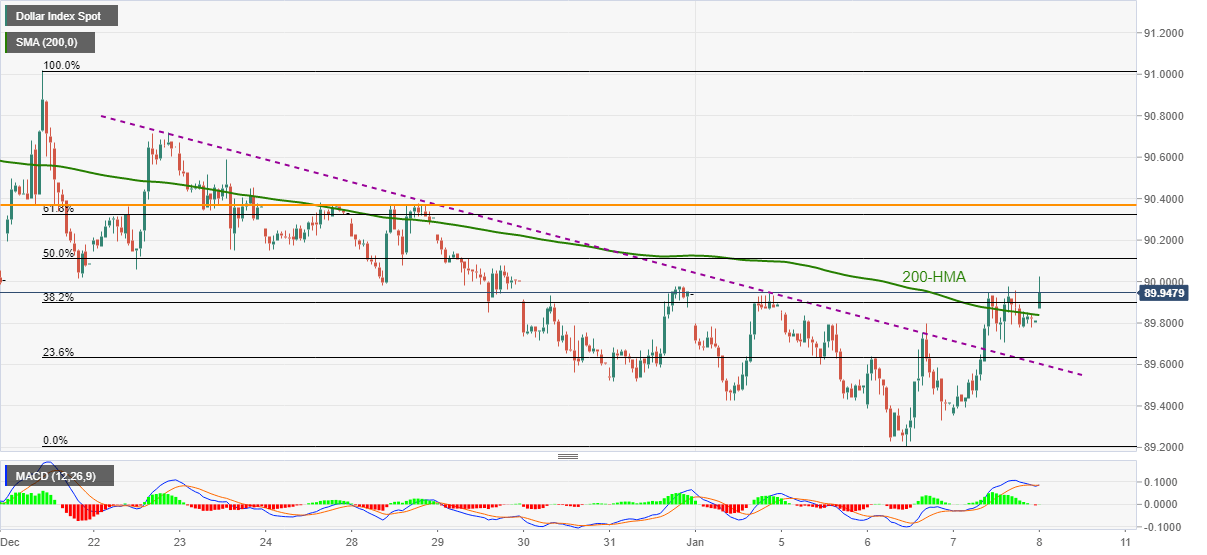
US dollar index (DXY) rises to 90.02, currently up 0.13% around 89.95, during early Friday. The greenback gauge crossed a downward sloping trend line from December 22 the previous day while struggling to provide a clear break above 200-HMA.
With the latest clear run-up beyond the key moving average, DXY is up for challenging the 50% Fibonacci retracement of December 21 to January 06 downside, around 90.15.
However, 61.8% Fibonacci retracement and multiple highs marked since December 24 will challenge the US dollar bulls near 90.32/37 afterward.
In a case where the greenback buyers step back, a downside break of 200-HMA and the previous resistance line, respectively around 89.85 and 89.60, will be the key to watch.
Should the DXY bears keep the reins past-89.60, the lowest since April 2018, flashed earlier in the week, close to 89.30, followed by the 89.00 round-figure may gain the market’s attention.
DXY hourly chart
Trend: Further recovery expected
