- DXY prints mild losses following failures to extend Friday’s recovery moves beyond 93.82.
- Sustained trading below short-term EMA confluence, weak MACD histogram favor sellers.
- Two-week-old ascending trend line, followed by monthly support line, probes the bears.
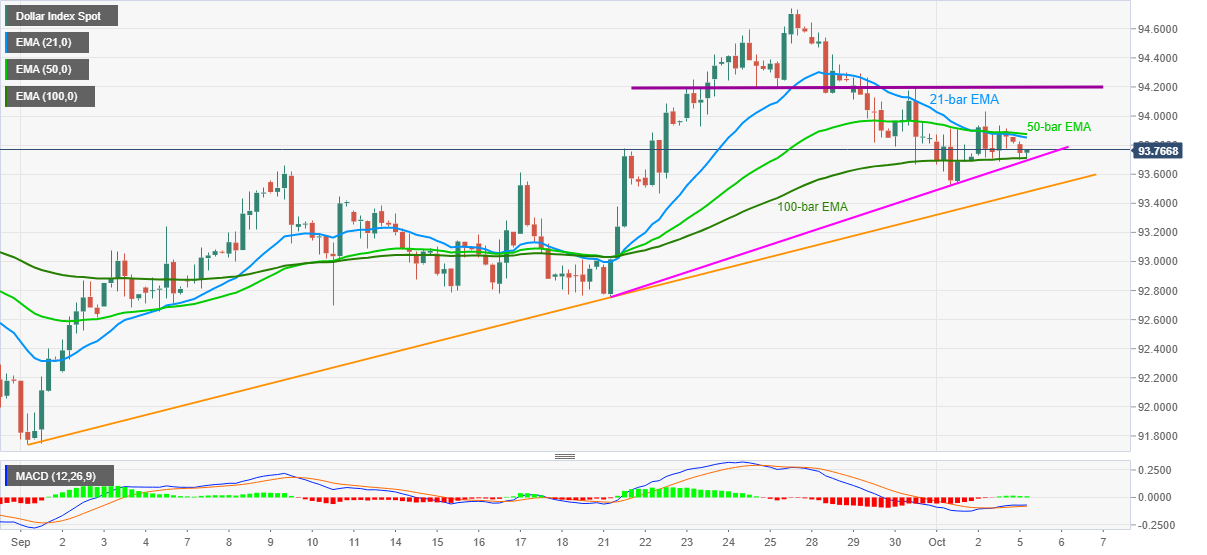
US Dollar Index (DXY) stays on the back foot around 93.70, down 0.11% intraday, during the pre-European open on Monday. In doing so, the greenback gauge fails to keep Friday’s gains amid dwindling MACD histogram.
Even so, a confluence of 100-bar EMA and an ascending trend line from September 21, around 93.70, restricts the quote’s immediate downside.
If at all the sellers retake controls below 93.70, they need to conquer a five-week-old rising support line, at 93.47 now, to prove themselves.
Meanwhile, buyers aren’t expected to enter unless witnessing a clear break above 93.87 comprising 21-bar and 50-bar EMA.
Following that, the 94.00 threshold and a horizontal line comprising late September top near 94.20 will be on the bulls’ radars.
DXY four-hour chart
Trend: Pullback expected
