- DXY corrects from recent YTD peaks around 92.50.
- So far, the 92.00 neighbourhood offers decent contention.
After climbing to fresh yearly highs in the mid-92.00s, DXY sparked a move lower to the 92.00/91.90 band.
The continuation of the uptrend looks likely despite the ongoing correction, which is also seem justified on recent overbought conditions of the index. A surpass of YTD tops around 92.50 should put the 200-day SMA at 92.88 on the radar.
A break above the latter should shift the outlook to a more constructive one and allow for extra gains to, initially, the November 2020 highs near 94.30 (November 2).
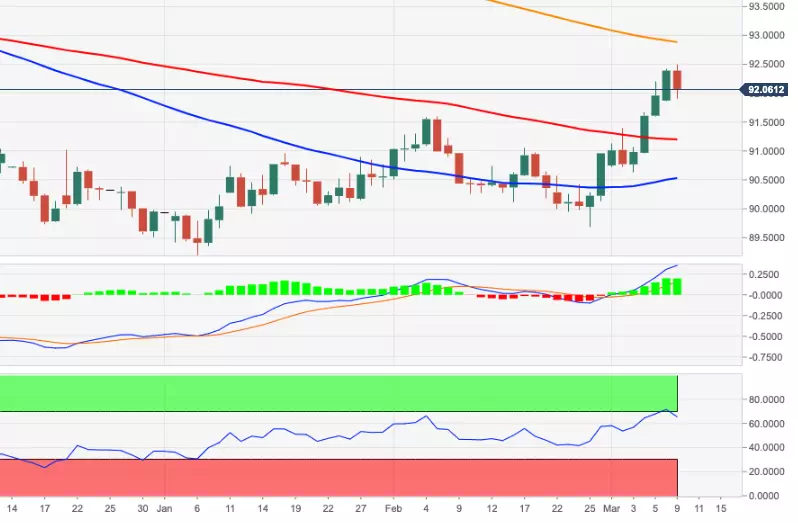
DXY daily chart