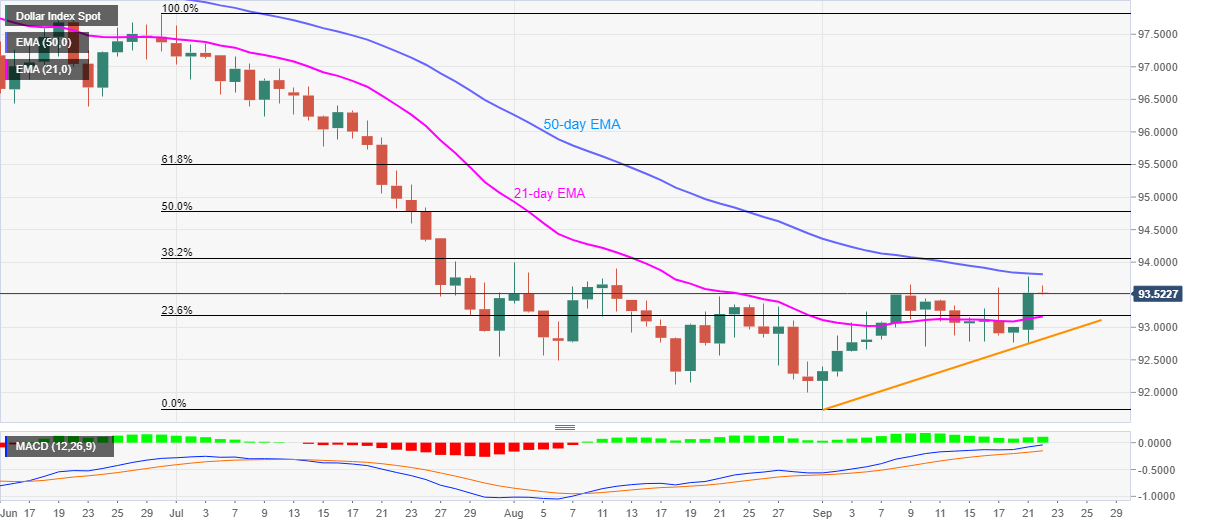
- DXY retraces gains from 93.77, the highest since August 12.
- 50-day EMA probes the buyers despite bullish MACD.
- 21-day EMA, 23.6% Fibonacci retracement offers immediate key support.
US dollar index (DXY) consolidates the previous day’s gains, the highest since late-August, while easing to 93.53 during early Tuesday. The greenback gauge probed August 12 top on Monday but failures to cross 50-day EMA seem to have triggered the latest pullback.
As a result, sellers are eyeing towards 93.17/16 support confluence including 21-day EMA and 23.6% Fibonacci retracement of June-September declines.
Also acting as the downside filter for DXY traders is the monthly ascending trend line near 92.82, a break of which will direct sellers to the August 18 low of 92.12 ahead of highlighting the previous month’s bottom surrounding 91.75.
Alternatively, a daily closing past-50-day EMA level of 93.81 will have to stay steady beyond the 94.00 threshold to convince the buyers.
In doing so, 50% and 61.8% Fibonacci retracement level of 94.77 and 95.50 will lure the FXY bulls.
DXY daily chart
Trend: Pullback expected
