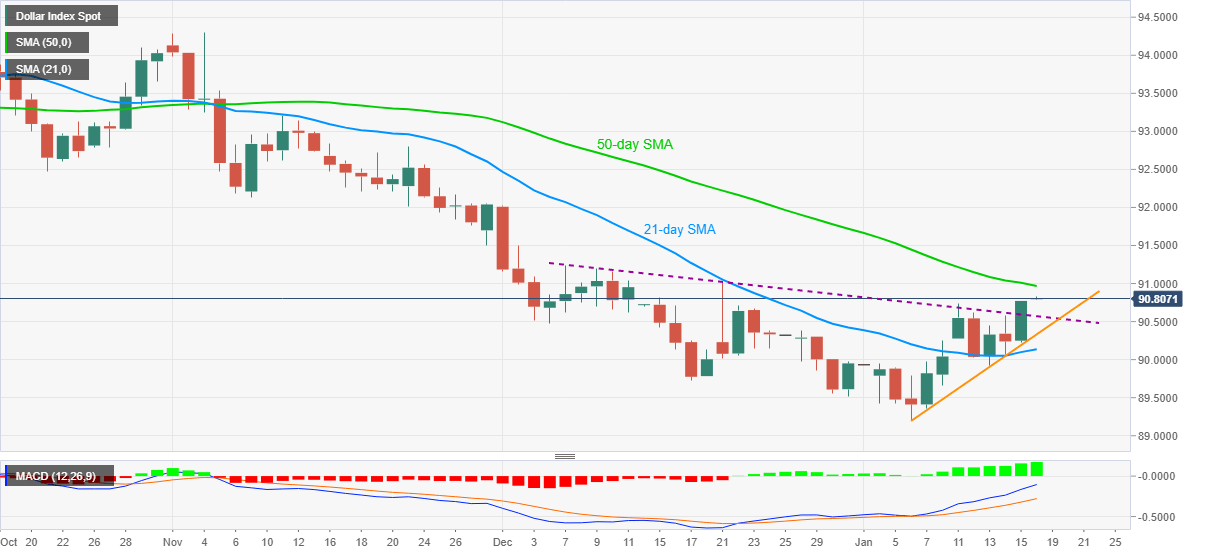
- DXY buyers cheer upside break of six-week-old falling trend line, bullish MACD.
- 21-day SMA, a two-week-old rising trend line add to the downside filters.
- December 07 top, early-November lows can lure bulls beyond 50-day SMA.
US dollar index (DXY) stays positive around 90.81 during Monday’s Asian session. In doing so, the greenback gauge extends the upside break of a descending trend line from December 07 towards a fresh high since December 21.
Not only the successful break of previously key resistance line but bullish MACD and sustained bounce off 21-day SMA also favor DXY bulls.
As a result, the quote is up for challenging a 50-day SMA level of 90.96 ahead of teasing the 91.00 round-figure and December 07 top surrounding 91.25.
It should, however, be noted that the US dollar index upside past-91.25 will propel it towards early November lows near 92.15.
On the contrary, a downside break below the previous resistance line, now support, near 90.57, will have to drop beneath an immediate rising support line, at 90.33, as well as a 21-day SMA level of 90.13 before revisiting the 90.00 psychological magnet.
In a case where the greenback sellers dominate below 90.00, the multi-month-low marked during the month around 89.20 should return to the charts.
DXY daily chart
Trend: Further upside expected
