- The prevalent risk-on mood dragged DXY to one-week lows on the first day of the week.
- The slide along a descending trend channel constitutes the formation of a bullish flag.
- Bullish oscillators on the daily chart further add credence to the constructive setup.
The US Dollar Index (DXY) maintained its offered tone through the early North American session and dropped to one-week lows, around the 92.70-65 region in the last hour.
As investors looked past Friday’s blockbuster US NFP report, the prevalent risk-on mood was seen as a key factor undermining the safe-haven greenback. Even a modest uptick in the US Treasury bond yields, upbeat US PMI prints failed to impress the USD bulls, albeit the upbeat US economic outlook should help limit any further losses.
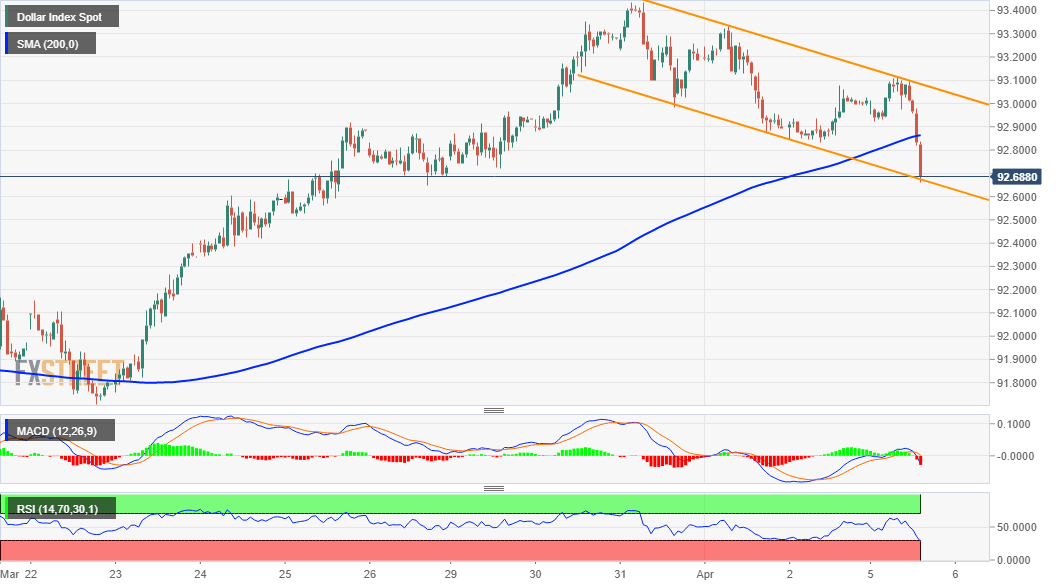
Looking at the technical picture, the recent pullback from multi-month tops has been along a downward sloping channel. Given that the DXY has now slipped below 200-hour SMA, the intraday bias seems tilted in favour of bearish traders. The negative outlook is reinforced by bearish technical indicators on hourly charts.
That said, the mentioned channel constitutes the formation of a bullish flag pattern. Moreover, oscillators on the daily chart – though have been retreating from higher levels – are still holding comfortably in the bullish territory. Hence, any subsequent fall might still be seen as a buying opportunity.
Meanwhile, the lower boundary of the mentioned channel coincides with the 23.6% Fibonacci level of the 103.00-89.21 downfall. This, in turn, should now act as a strong base for the DXY, which if broken decisively will set the stage for additional losses towards testing the very important 200-day SMA, around mid-92.00s.
On the flip side, the 92.85-90 region (200-hour SMA) now seems to act as immediate resistance. This is followed by the top boundary of the descending channel, currently near the 93.10 region. A convincing breakthrough will confirm a bullish breakout and push the DXY back towards multi-month tops, around the 93.45-50 region.
DXY 1-hour chart
Technical levels to watch
