- DXY stays depressed after beginning the week with a downside gap to fresh multi-month low.
- Bearish MACD, sustained trading below short-term resistance line, HMA favor sellers.
- The 92.00 round-figure can offer an immediate upside barrier.
US dollar index (DXY) remains on the back foot around 91.69, the lowest levels since April 30, 2018, during the early Monday. The greenback gauge began the week with the downside gap below the yearly bottom, marked in September.
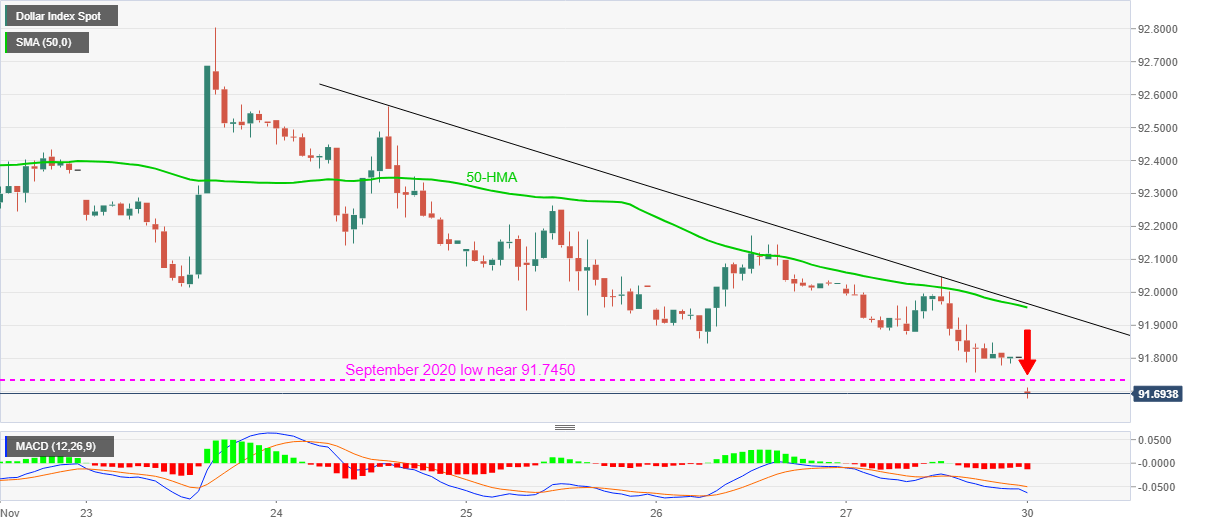
With the MACD flashing bearish signals and a confluence of 50-HMA and one-week-old falling trend line restricting the DXY’s immediate upside, it becomes safe to say that the greenback bears have the controls.
The same can keep the US dollar sellers directed towards the March 2018 high near 90.95 while April 27, 2018 bottom close to 91.50 and the lows marked in September 2017 close to 91.00, offer intermediate halts during the south-run.
On the contrary, September 2020 low near 91.7450 offers immediate resistance ahead of the joint of 50-HMA and a short-term resistance line near 91.95.
However, buyers are less likely to consider taking risks of buying unless the quote crosses the 92.00 threshold.
DXY hourly chart
Trend: Bearish
