- US dollar index (DXY) consolidates its advance below the 100.00 mark.
- Support should emerge near the 99.50 and 99.00 price levels.
- The level to beat for buyers is the 100.00 level.
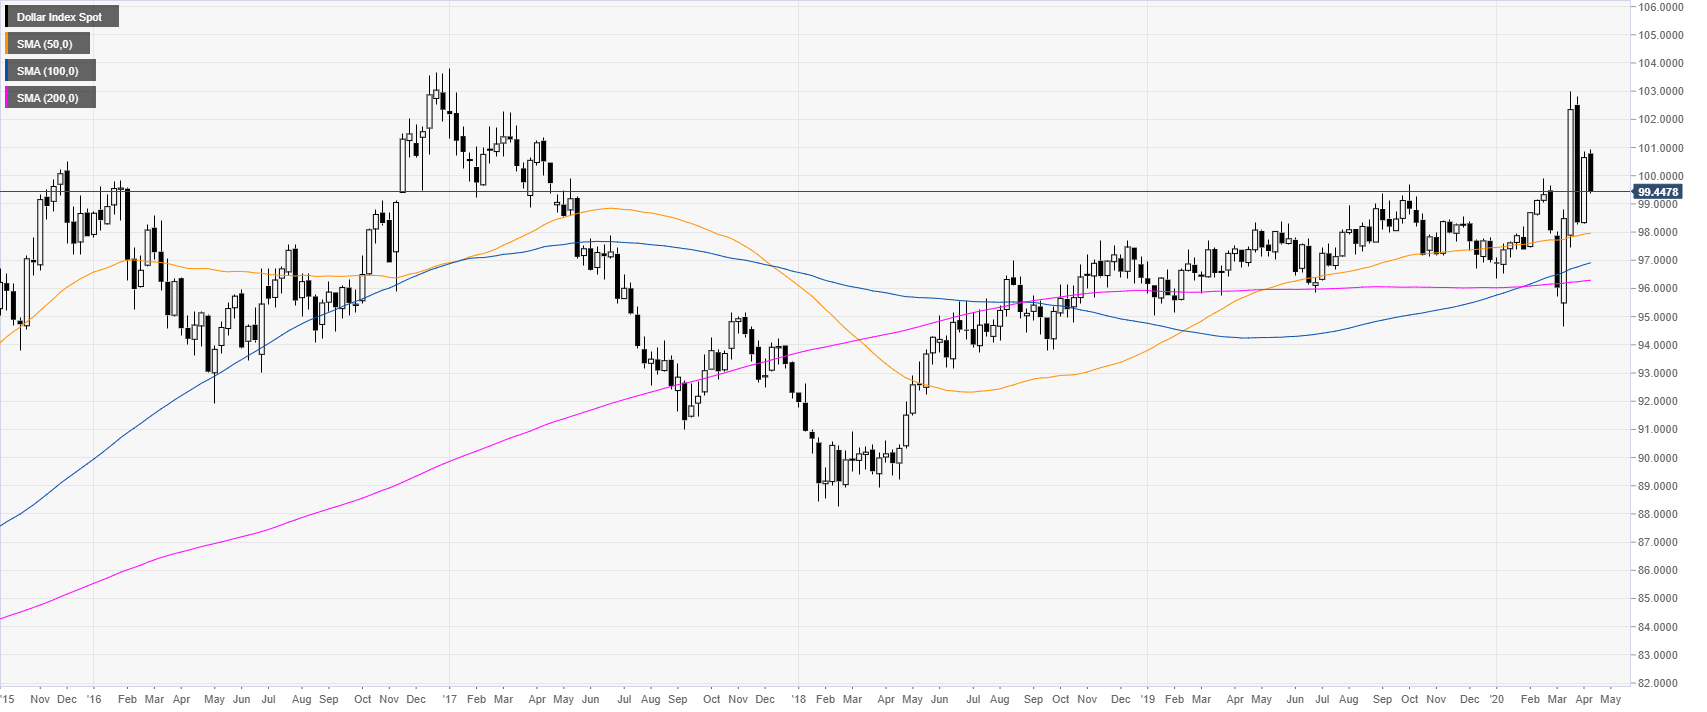
DXY weekly chart
The greenback erased parts of the gains made last week as the market trades below the 100.00 mark and stays above its main weekly SMAs suggesting that the bull trend remains intact.

DXY daily chart
DXY is trading in 2.5-week lows as the market pulls back down slightly while still maintaining a bullish momentum above the main daily SMAs.
DXY four-hour chart
DXY slipped below the 100 mark and below its 50/100 SMAs on the four-hour chart but still above the 200 SMA suggesting that the uptrend remains intact. The index is finding support near the 99.50 level and if bulls can rebound and regain the 100.00 figure DXY can appreciate further towards the 105.50 and 101.00 levels. Meanwhile, support is seen near the 99.00 and 98.30 levels.

Additional key levels
