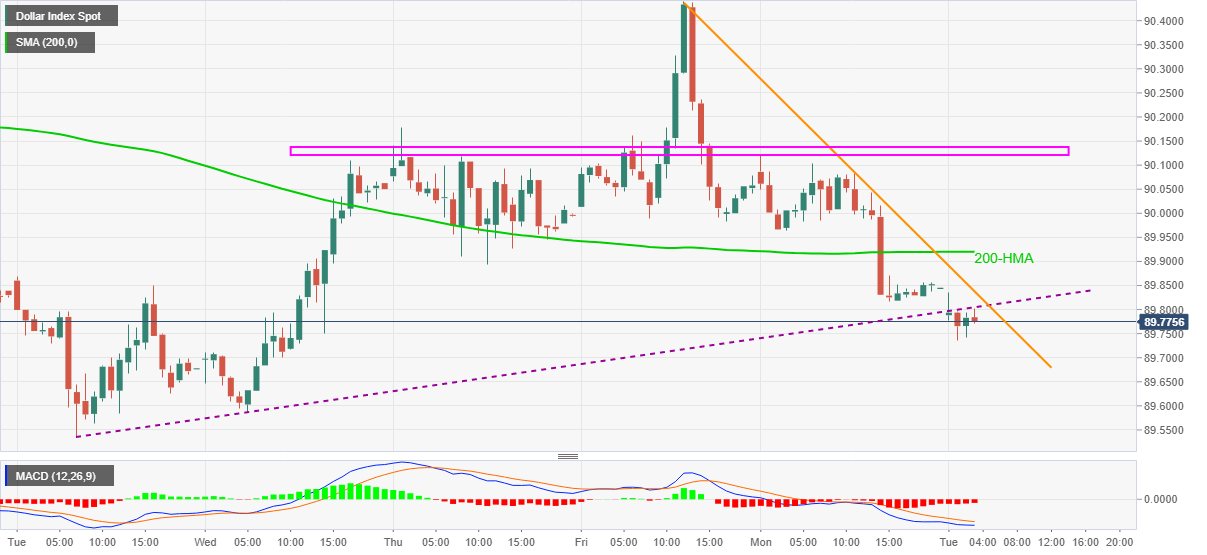
- DXY keeps weekly trend line breakdown below 200-HMA.
- Bearish MACD, immediate faling trend line also exert downside pressure.
US dollar index (DXY) remains on the back foot for the second consecutive day on early Tuesday, not to forget after posting a two-month south-run. That said, the US dollar gauge versus major currencies print 0.08% intraday losses to 89.77 by the press time of the pre-European session.
In doing so, the DXY slips below the one-week-old rising trend line, also extending Monday’s breakdown of 200-HMA amid bearish MACD signals.
Against this backdrop, bears keep the reins while targeting the multi-month low flashed late May around 89.50. Though, any further downside will not only have to break the yearly bottom near 89.20 but also the 89.00 threshold to negate any rebound.
Meanwhile, the corrective pullback will have a tough time as a two-day-long falling trend line and the horizontal area comprising multiple tops from Thursday add to the upside barriers.
Among the nearby resistances, the previous support line and immediate falling trend line could stop the run-up below 89.85. The 200-HMA level of 89.92 also acts to the adjacent hurdles to the north.
It’s worth noting that the recovery moves may gain traction once the horizontal area around 90.15 is crossed.
DXY hourly chart
Trend: Bearish
