- US dollar index fades breakout of 13-day-old falling trend line.
- Normal RSI conditions, bearish chart pattern pushes bears toward waiting for 90.75 breakdown.
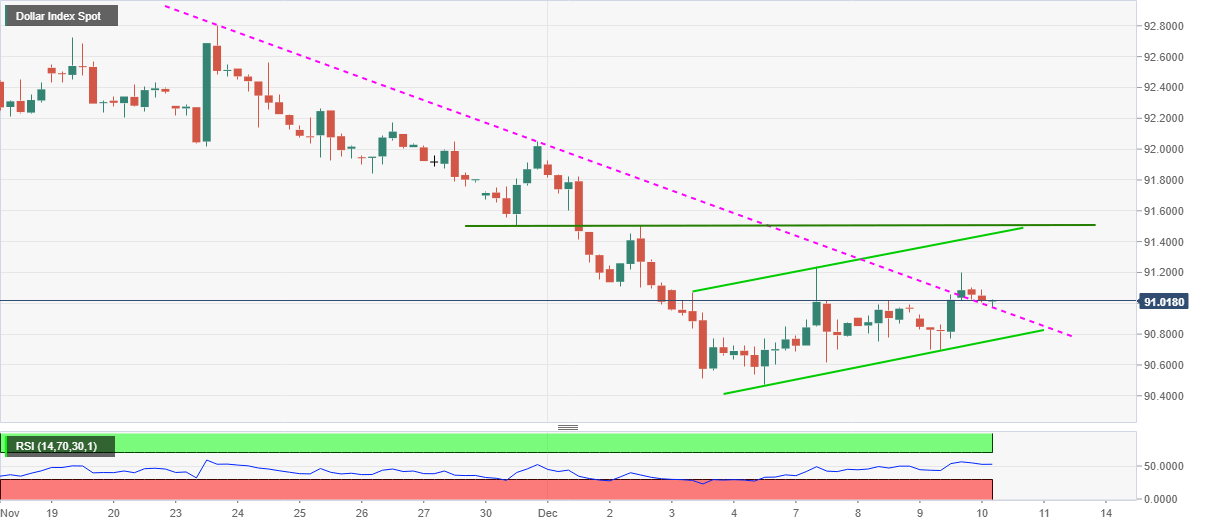
US dollar index (DXY) snaps four-day uptrend while easing to 91.00, down 0.03% intraday, ahead of Thursday’s European session. In doing so, the greenback gauge, versus the major currencies, defies the upside break of a short-term resistance line, now support, while also challenging recovery moves from April 2018 low marked last Friday.
The DXY also prints a bearish chart pattern on the four-hour (4H) play amid normal RSI conditions, which in turn suggests sellers’ are eager to take entries.
Though, a clear downside break of the flag’s support line, at 90.75, will be needed to eye the year 2018 low of 88.25. Though, the 90.00 psychological magnet can play a major role to probe the bears.
Meanwhile, 91.25 and the stated flag’s resistance near 91.45 can challenge the DXY bulls ahead of directing them to the horizontal line comprising December 02 high and November 30 low near 91.50.
In a case where the greenback buyers manage to keep the reins past-91.50, a run-up towards 92.00 can’t be ruled out.
DXY four-hour chart
Trend: Bearish
