- DXY keeps bounce off two-week low despite recent inactivity.
- 200-bar SMA, monthly support line and receding strength of bearish MACD favor greenback buyers.
- 61.8% Fibonacci retracement adds to the downside support.
US dollar index (DXY) wavers around mid-90.00s during Thursday’s Asian session. The greenback gauge dropped to the lowest since January 27 before bouncing off 90.25 the previous day.
The corrective pullback takes support from a one-month-old support line and 200-bar SMA as MACD fades the bearish signs.
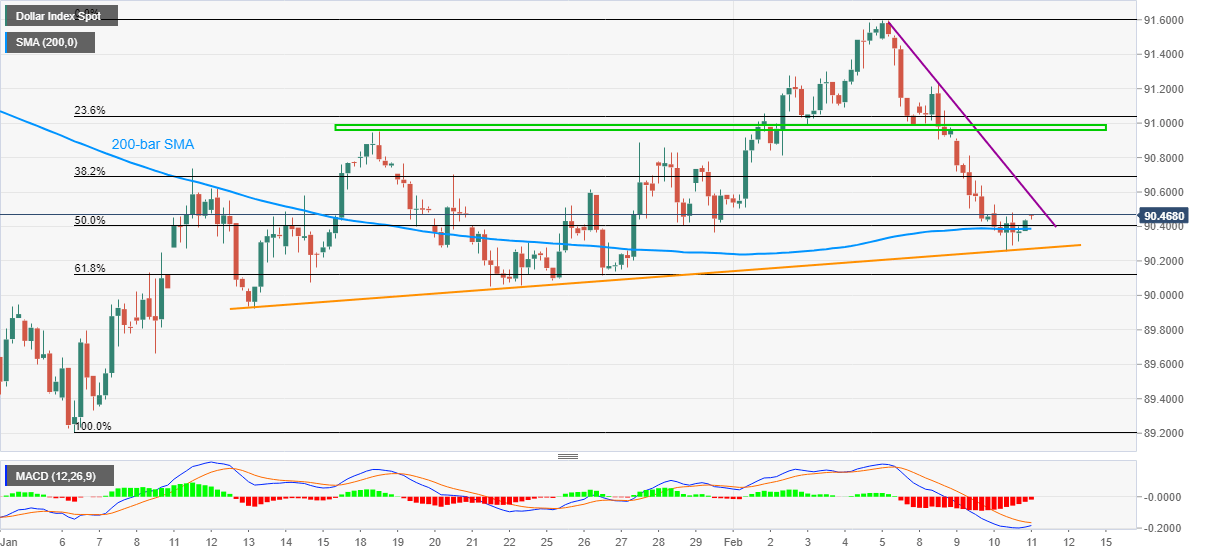
As a result, the DXY recovery seems to last, at least for now, which in turn highlights a downward sloping resistance line from February 05, at 90.57 now.
Should the greenback buyers manage to cross the immediate hurdle, an area including multiple levels marked since January 18, around 91.00, become the key to the further upside towards the monthly top of 91.59.
Meanwhile, 50% Fibonacci retracement of the quote’s upside from early January to February 05 joins 200-bar SMA around 90.40 to test short-term sellers.
Also acting as strong support is the ascending trend line from January 13 and 61.8% Fibonacci retracement level, respectively near 90.27 and 90.12.
DXY four-hour chart
Trend: Further recovery expected
