- DXY recovered from multi-month lows on Friday but it is still struggling below the 200 DMA.
- Support is seen at the 97.00 and 96.70 levels.
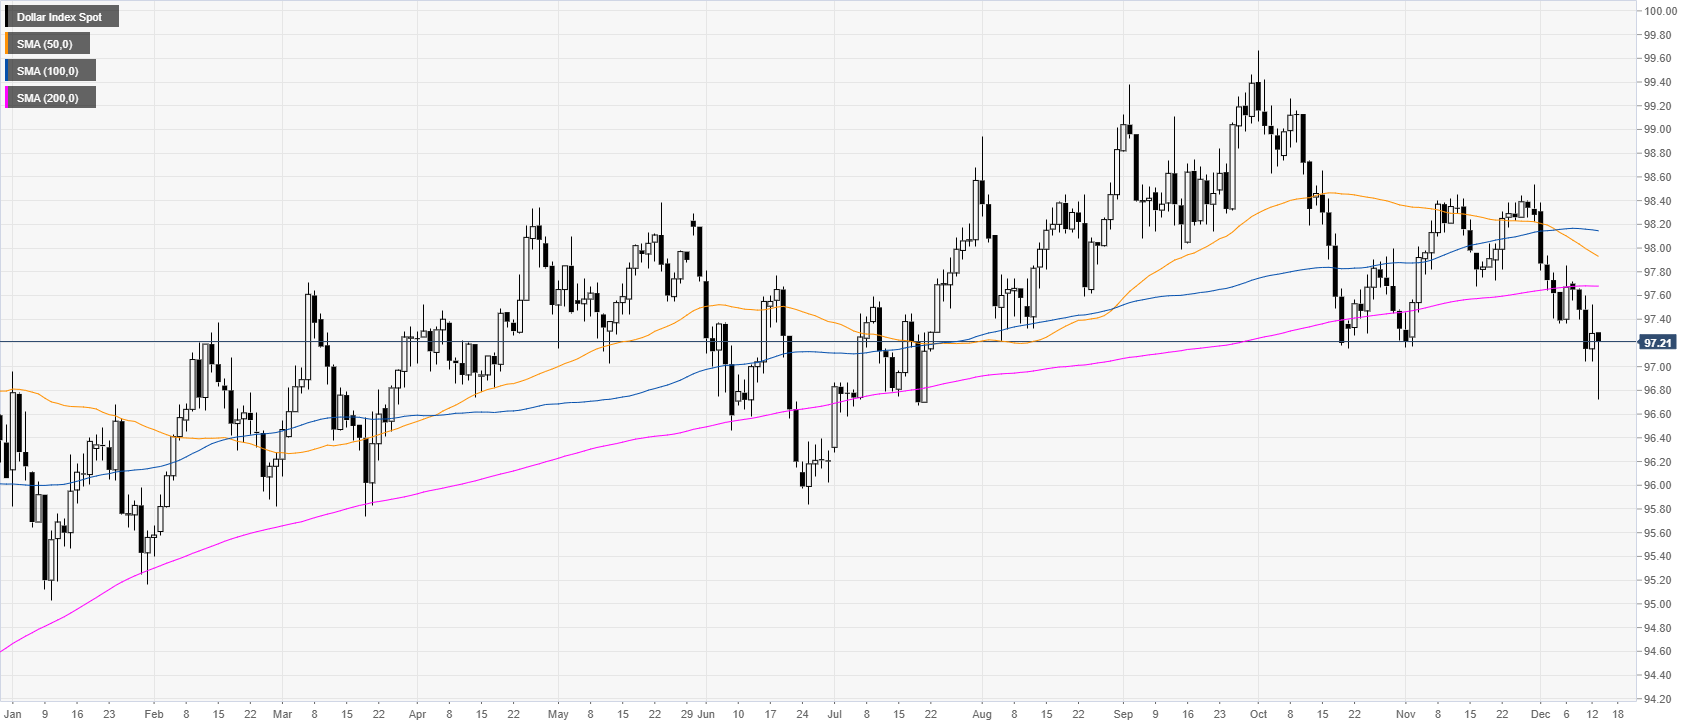
DXY daily chart
DXY (US Dollar Index) spiked down to its lowest since July and then recouped some of the lost ground. However, the index remains fragile while below the 200-day simple moving average (DMA).
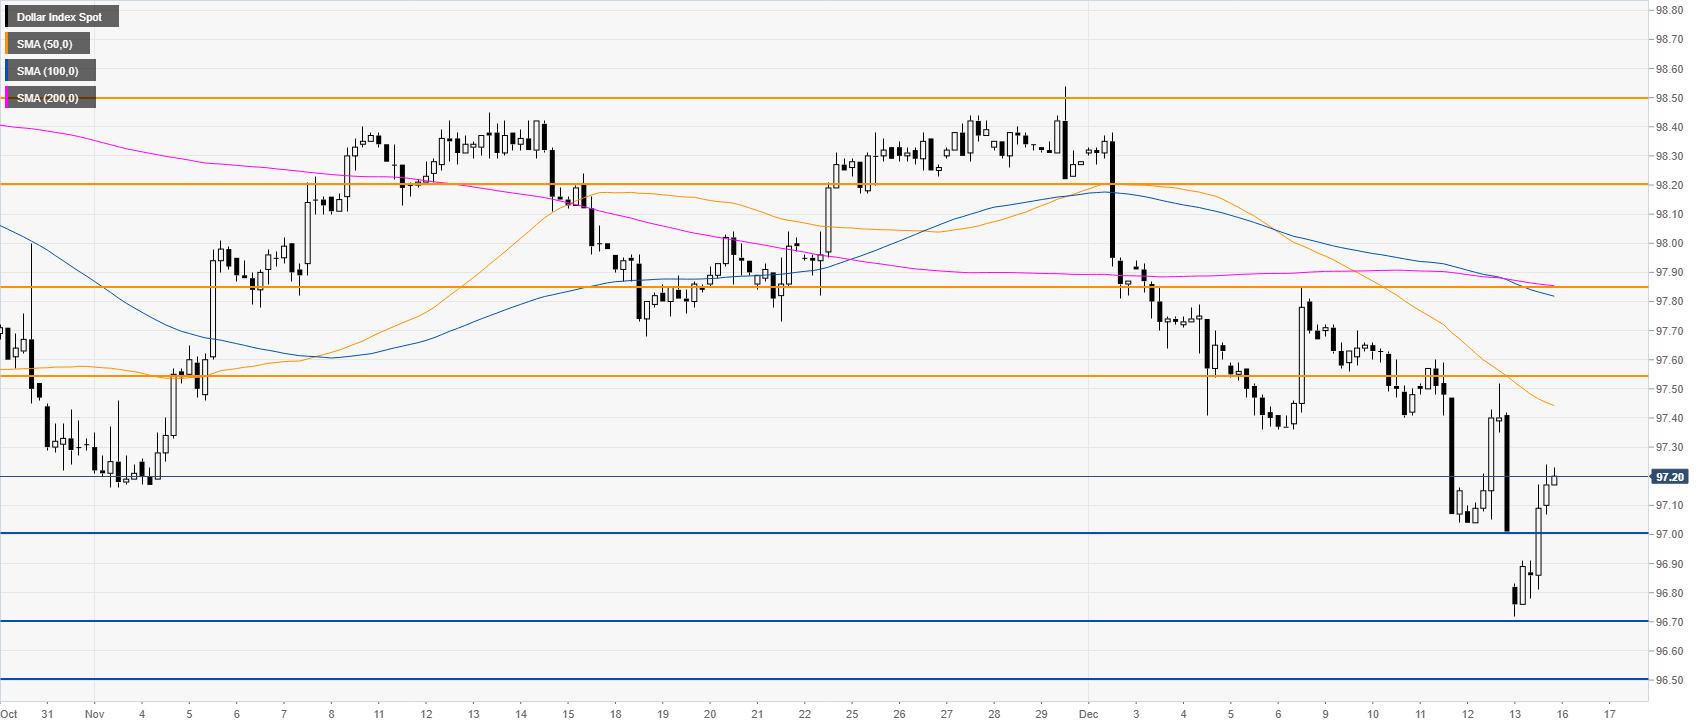
DXY four-hour chart
Although the market is retracing up, DXY remains under bearish pressure below the 97.55 resistance and the main SMAs. Next week bears might try to have another chance at the 97.00 handle. Further down lie the 97.70 and 97.50 price levels.
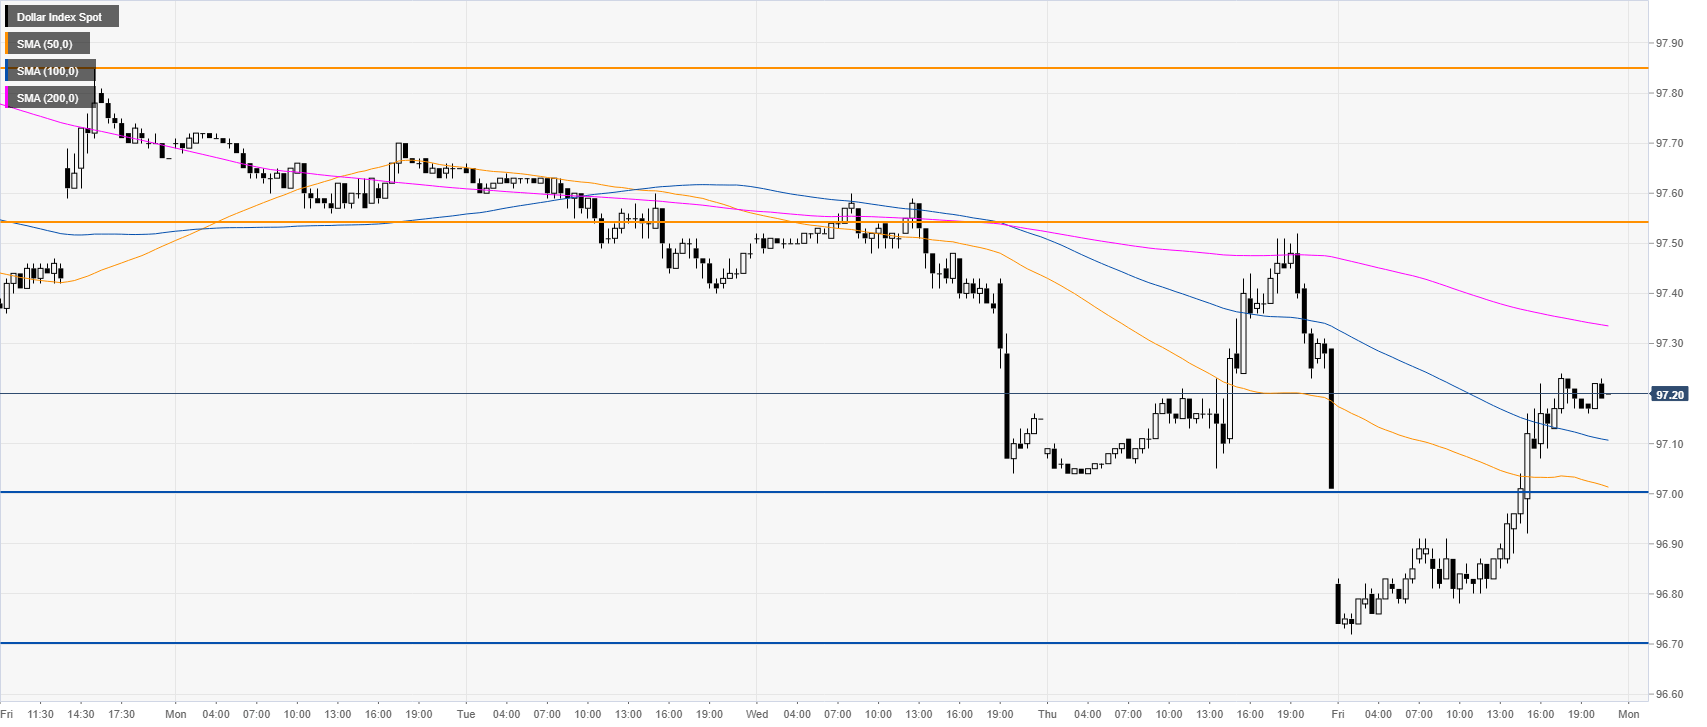
DXY 30-minute chart
DXY bulls would need a breakout above the 97.55 resistance and the 200 SMA. Looking up, the next resistance probably lies near the 97.85 level.
Additional key levels
