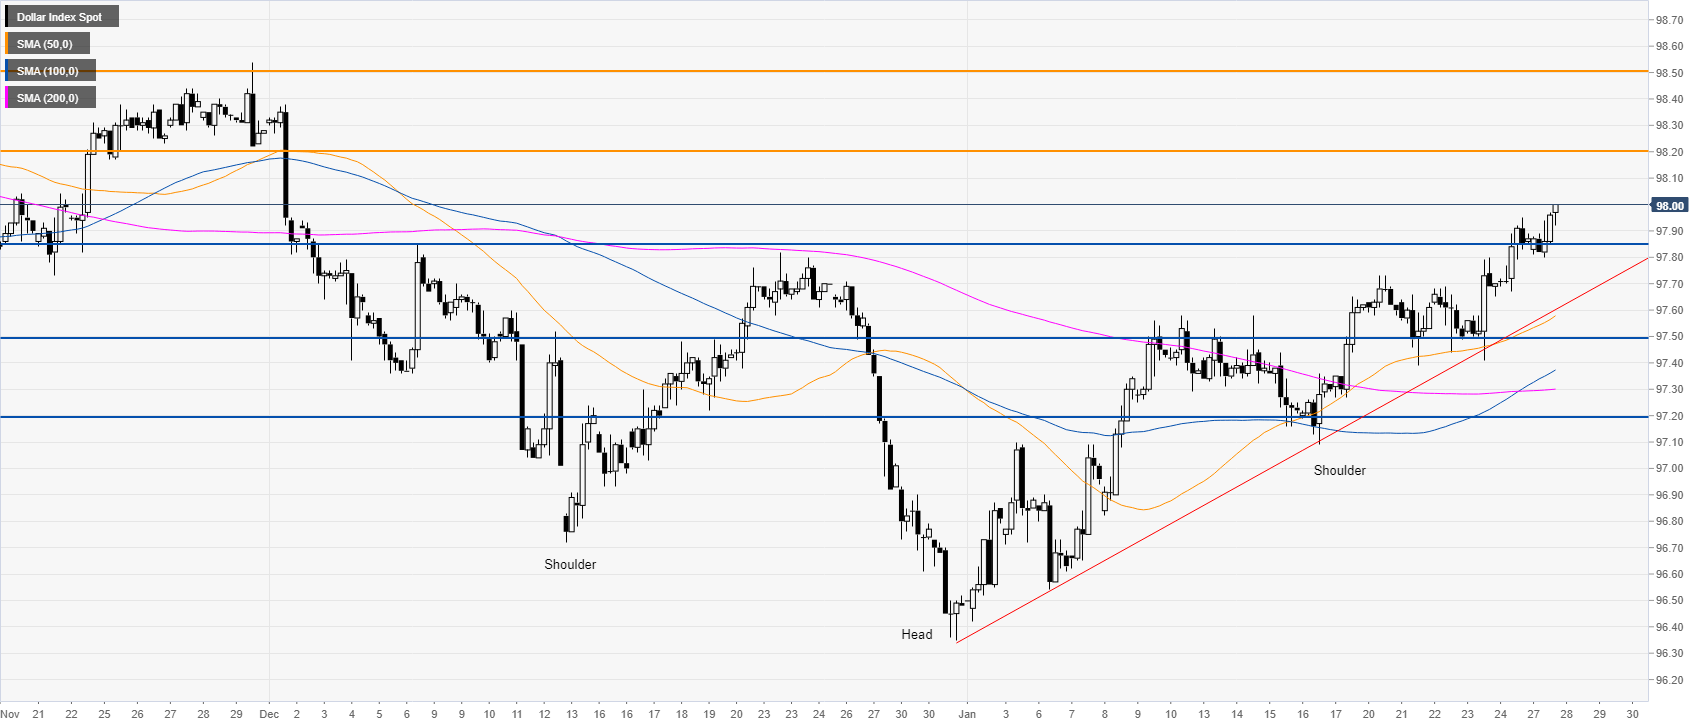
- The inverse head-and-shoulders pattern is sending the market near two-month highs
- Targets on the way up can be located near the 98.20 and 98.50 levels.
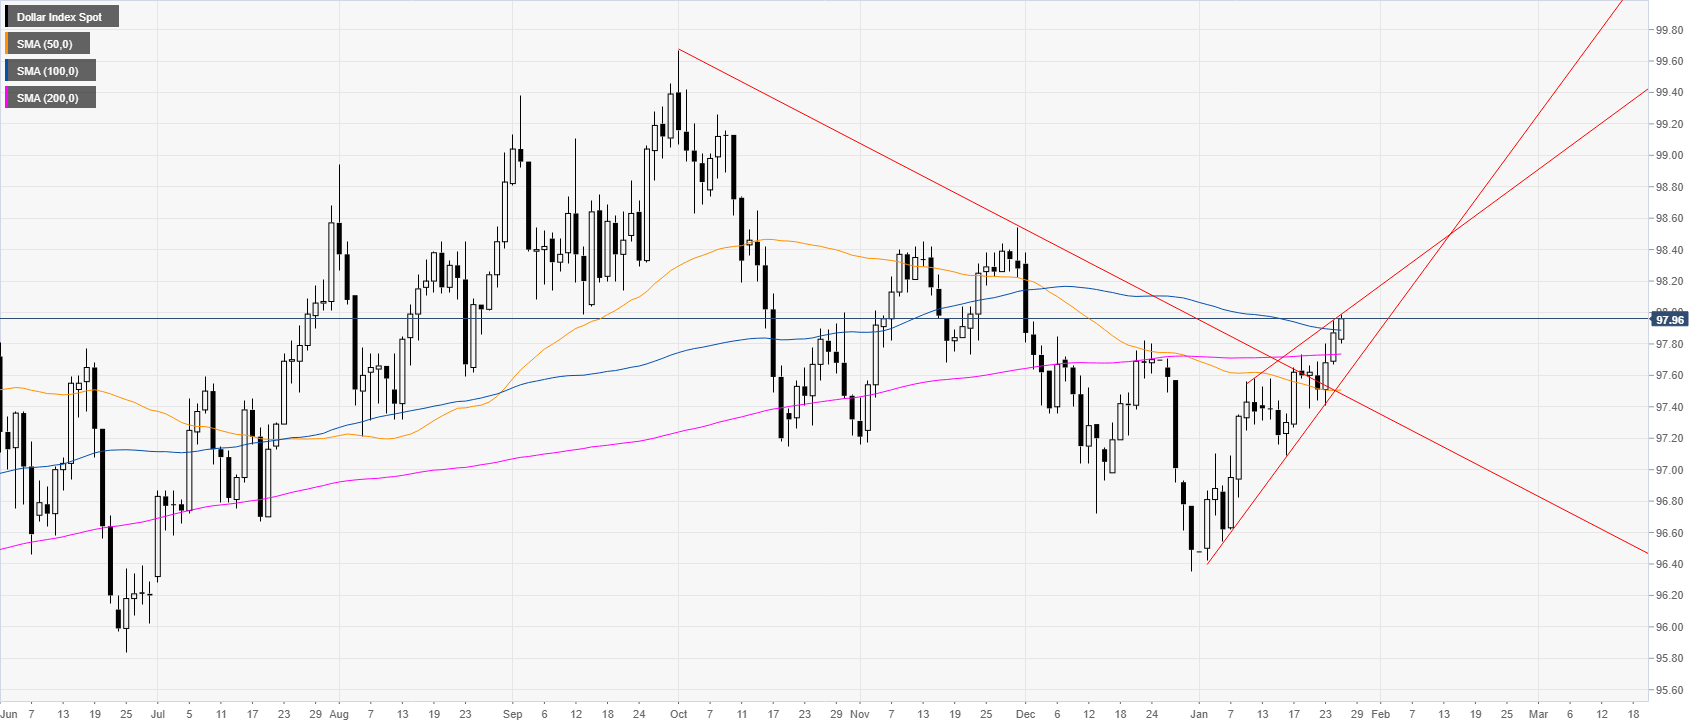
DXY daily chart
The US dollar index (DXY) is challenging the 98.00 figure and the 100-day simple moving average (SMA) while advancing in a bullish channel.
DXY four-hour chart
DXY is trading above its main simple moving averages (SMAs) and an ascending trendline, suggesting a bullish bias in the medium term. The greenback is breaking out from an inverted head-and-shoulders pattern which is keeping the spot above the 97.85 resistance now turned support. As the market stays above 97.85 the bulls are most likely to reach 98.20 and potentially 98.50 on the way up if they gather enough steam. Support is seen at 97.85 and 97.50 price levels.
Additional key levels
