Home US Dollar Index Price Analysis: Further south comes in the 200-day SMA
FXStreet News

US Dollar Index Price Analysis: Further south comes in the 200-day SMA

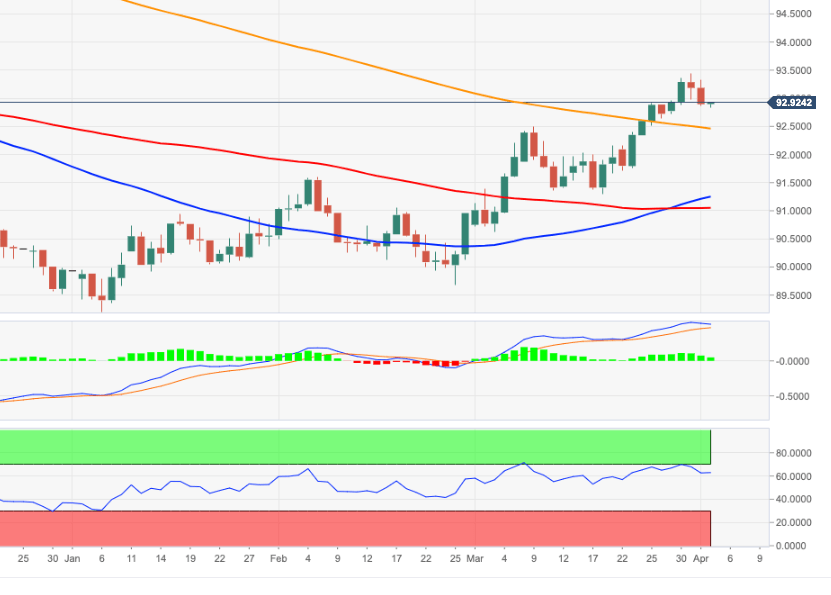
  • DXY extends the corrective downside to 92.85/80 band.
  • Immediate contention is located at the 200-day SMA at 92.45.

The dollar extends the rejection from recent yearly highs near 93.50 and re-visits the 92.80 zone on Friday.

If the selling impulse gains further traction, then DXY could re-visit the key 200-day SMA in the mid-92.00s.

A convincing return to the area below the 200-day SMA should negate the ongoing near-term constructive stance.

DXY daily chart
 

FX Street

FX Street

FXStreet is the leading independent portal dedicated to the Foreign Exchange (Forex) market. It was launched in 2000 and the portal has always been proud of their unyielding commitment to provide objective and unbiased information, to enable their users to take better and more confident decisions.