- DXY has extended the correction lower to the sub-99.00 area.
- Immediately to the south is the 200-day SMA at 98.18.
DXY is trading in fresh 2-day highs and manages well to rebound from fresh multi-day lows in levels below the key 99.00 mark.
While the constructive bias is expected to remain unchanged while above the 200-day SMA, today at 98.18, further downside should not be ruled out in the short-term horizon.
That said, the late March lows in the 98.30 region could be revisited ahead of a potential test of the critical 200-day SMA.
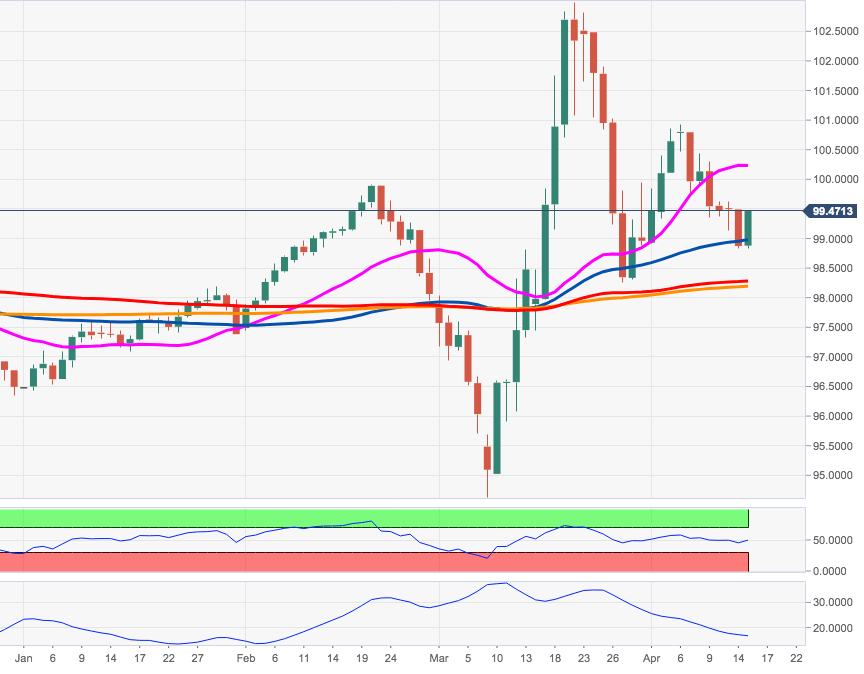
DXY daily chart