- DXY fades Monday’s uptick and recedes below the 93.00 level.
- The 93.30 zone offers interim resistance in the near-term.
DXY resumes the downside following Monday’s positive price action and comes under renewed selling pressure after a failed sustainable move beyond 93.00.
In the meantime, it seems occasional bullish attempts remain capped by the 93.30 region, where converge the 55-day SMA and the 6-month resistance line. A surpass of this area should open the door to a visit to last week’s tops around 93.90 (October 15).
While below the 200-day SMA, today at 96.68, the negative view on the dollar is expected to persist.
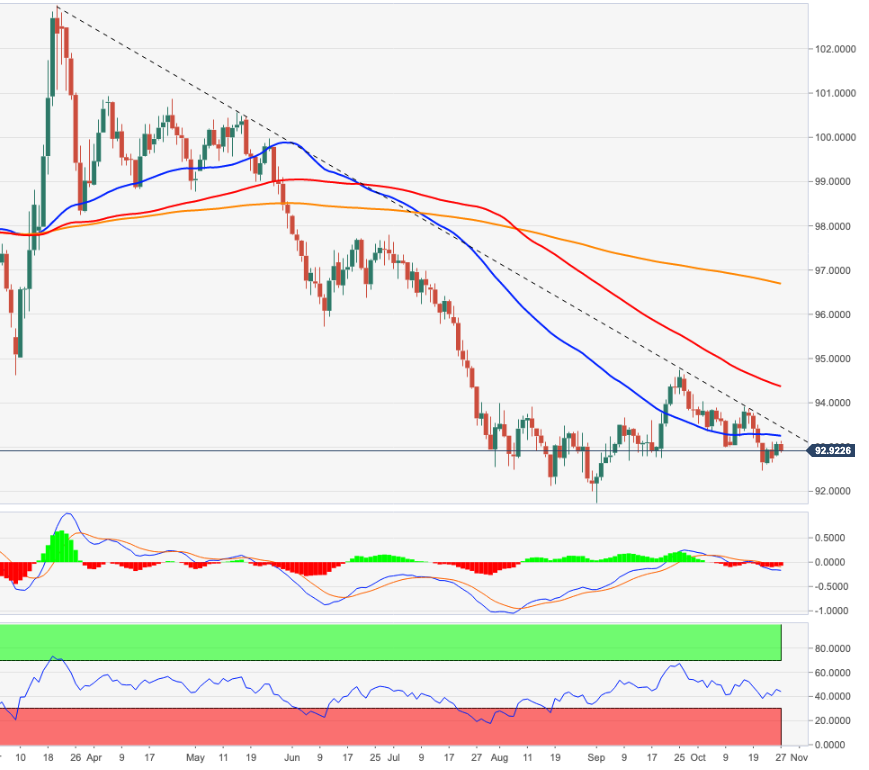
DXY daily chart