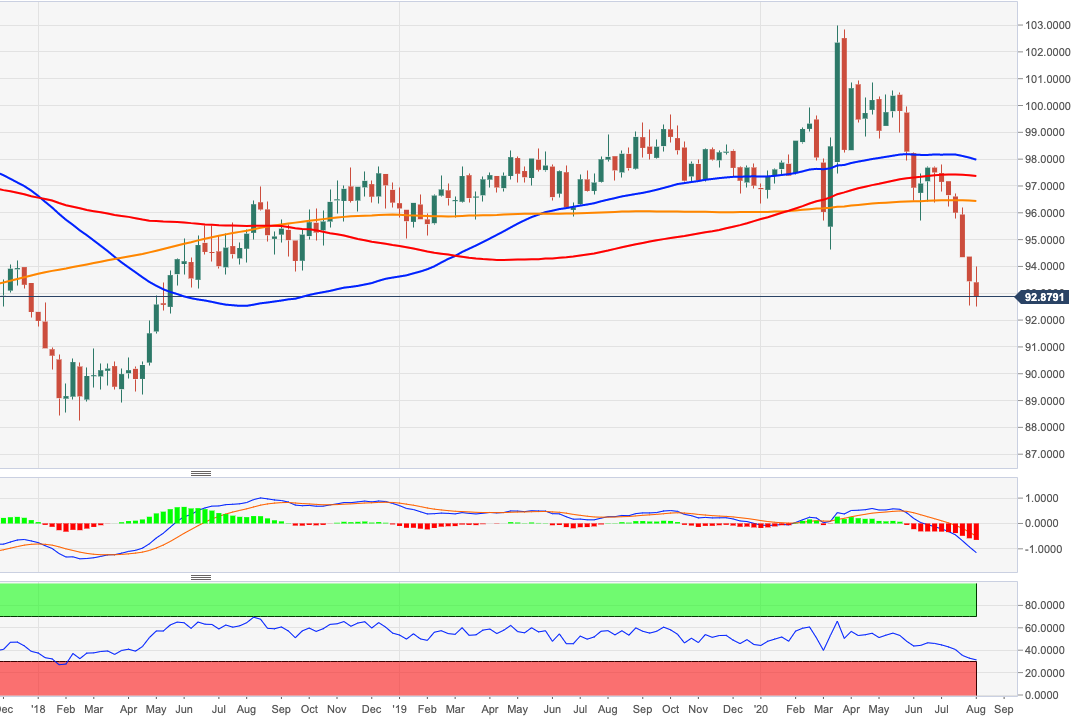
- DXY prints fresh lows at 92.52 in the second half of the week.
- Further decline is seen visiting the 91.92/80 band.
Sellers remain well in control of the sentiment around the dollar and pushed DXY further south to 92.52, recording at the same time fresh lows last seen in May 2018.
In fact, further downside is increasingly likely in the current context. If 92.52 is breached on a convincing fashion, then there are no support of relevance until the Fibo level (of the 2017-2018 drop) at 91.92 ahead of the May 2018 low at 91.80.
The negative outlook on the dollar is expected to remain unaltered while below the 200-day SMA, today at 97.94. Of note: the 100-day SMA (97.98) is about to break below the 200-day SMA (97.94), adding to the bearish scenario.
DXY weekly chart