- DXY trims intraday losses while reversing pullback from early December top.
- Sustained break of 50-day SMA, bullish MACD, upbeat RSI favor buyers.
- Trend reversal suggesting candlestick shouldn’t be ignored at multi-day high.
US dollar index (DXY) picks up bids around 91.05 while reversing the early Asian losses ahead of Wednesday’s European session. Even so, the greenback gauge stays near the two-month top flashed the previous day.
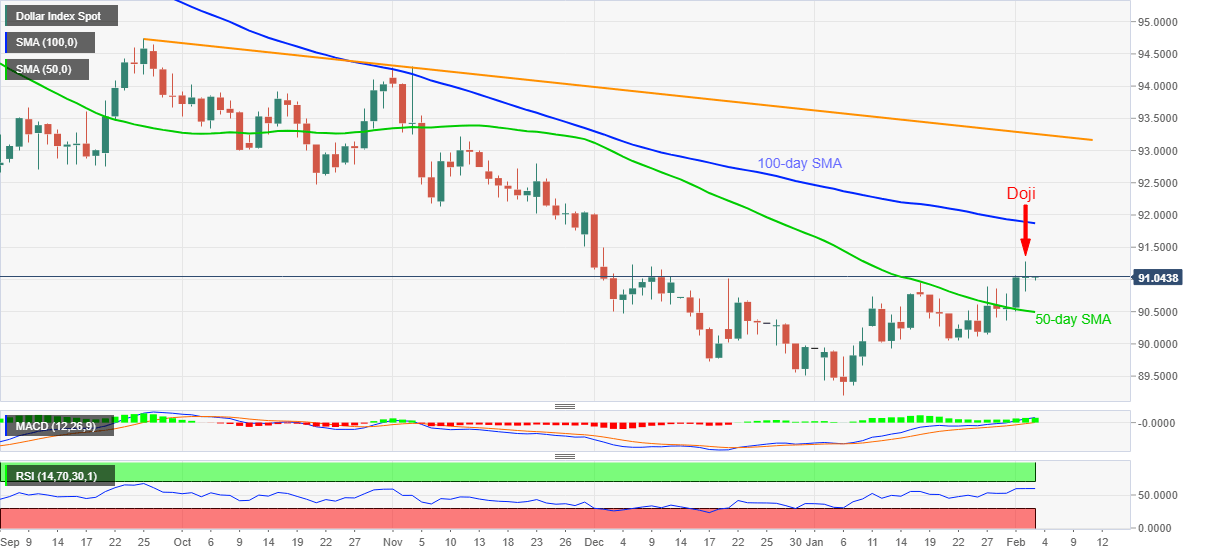
DXY stretched the upside break of January top towards 91.27 before closing the day with little changes around 91.04, which in turn portrayed a Doji candlestick on the daily (1D) formation.
While Doji suggests a reversal of the present uptrend, bullish MACD, strong RSI conditions and successful trading beyond 50-day SMA, at 90.49 now, test US dollar sellers.
In a case where the greenback bears manage to dominate past-90.49, the 90.00 threshold and 89.53 can offer an intermediate halt before recalling January’s bottom surrounding 89.20.
Alternatively, an upside break of 91.27 rejects the candlestick pattern and pushes the DXY towards a 100-day SMA level of 91.87.
Though, any further advances will have to cross the early November lows near 92.15 before challenging a descending trend line resistance line from September 2020, around 93.25.
Overall, the US dollar index is strong enough to extend the latest gains but an intermediate pullback can’t be ruled out.
DXY daily chart
Trend: Pullback expected
