- The knee-jerk in the index tests the 97.35/30 band, daily lows.
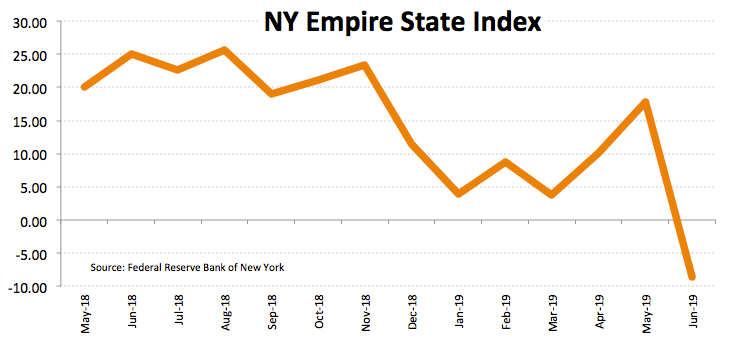
- NY Empire State index dropped to -8.6 in June.
- US NAHB, TIC Flows coming up next.
The US Dollar Index (DXY), which measures the greenback vs. a bundle of its main rivals, has now faded the initial optimism and receded to the 97.3530 band, or daily lows.
US Dollar Index offered on data, looks to Fed
Following three daily advances in a row, the index is now losing some shine and trading in the lower bound of the daily range in response to the re-emergence of the selling bias among traders.
In fact, the downside pressure picked up some pace after the NY Empire State Index unexpectedly dropped to -8.6 for the current month, recording the lowest level since October 2017 and at the same time reigniting chatter of a probable rate cut as soon as the July meeting.
Later in the NA session, the NAHB index is due along with TIC Flows for the month of April.
What to look for around USD
Markets participants continue to price in the likelihood of rate cuts by the Fed in the next months and this is somehow limiting upside potential in the index. While an ‘insurance cut’ looks likely sooner than later according to market chatter, the upcoming FOMC meeting should shed more light on to the issue and is expected to give further details on the impact of trade tensions on the US economy. However, and in spite of some disappointing results in US fundamentals as of late, the labour market remains strong, wage growth keep pushing higher and the overall economy looks healthy – specially when we consider the weakness in overseas economies – all begging the question whether current speculations of rate cuts are not overdone.
US Dollar Index relevant levels
At the moment, the pair is losing 0.04% at 97.41 and a breakdown of 97.02 (100-day SMA) would aim for 96.53 (200-day SMA) and then 96.46 (low Jun.7). On the upside, the next resistance is located at 97.58 (high Jun.14) seconded by 97.87 (61.8% Fibo of the 2017-2018 drop) and finally 97.71 (high Mar.7).