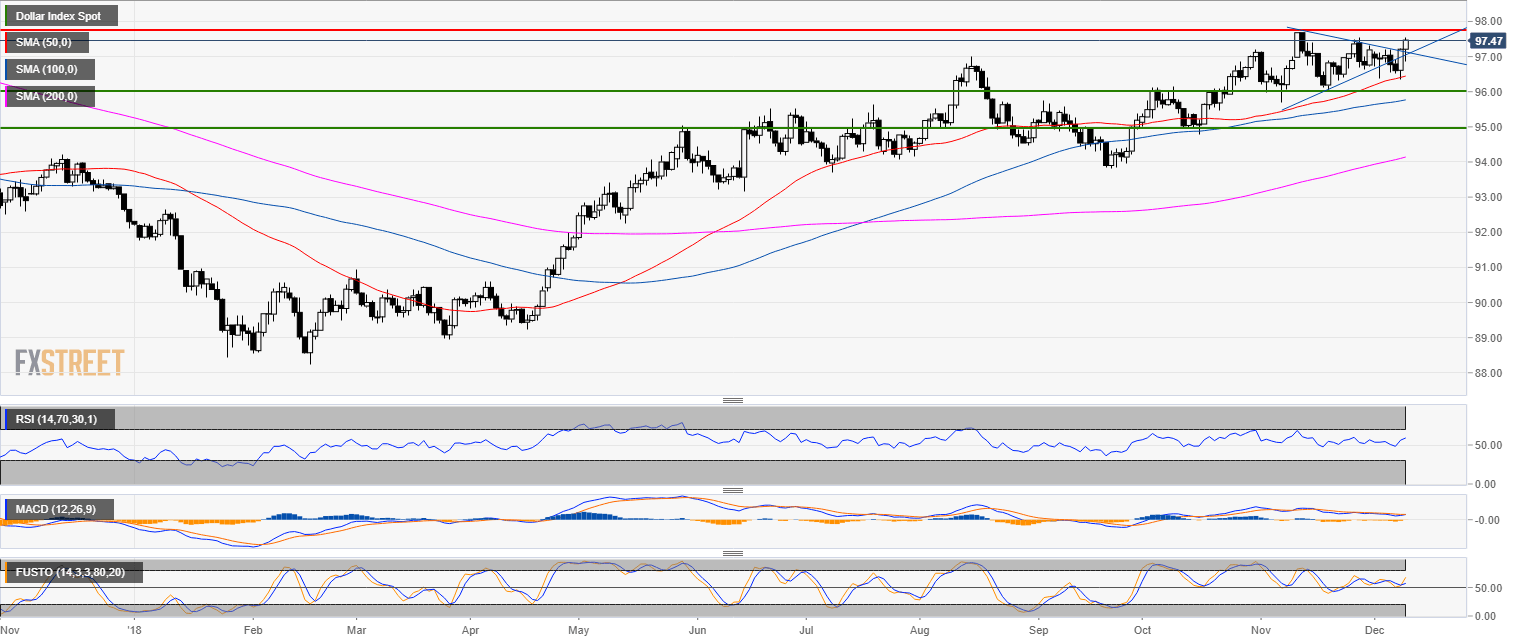
DXY daily chart
- The US Dollar Index (DXY) is trading in a bull trend above its main simple moving averages.
- DXY broke to the upside from the triangle pattern suggesting a potential extension to 97.70 (2018 high).
- As forecast, DXY hit the 97.54 target.
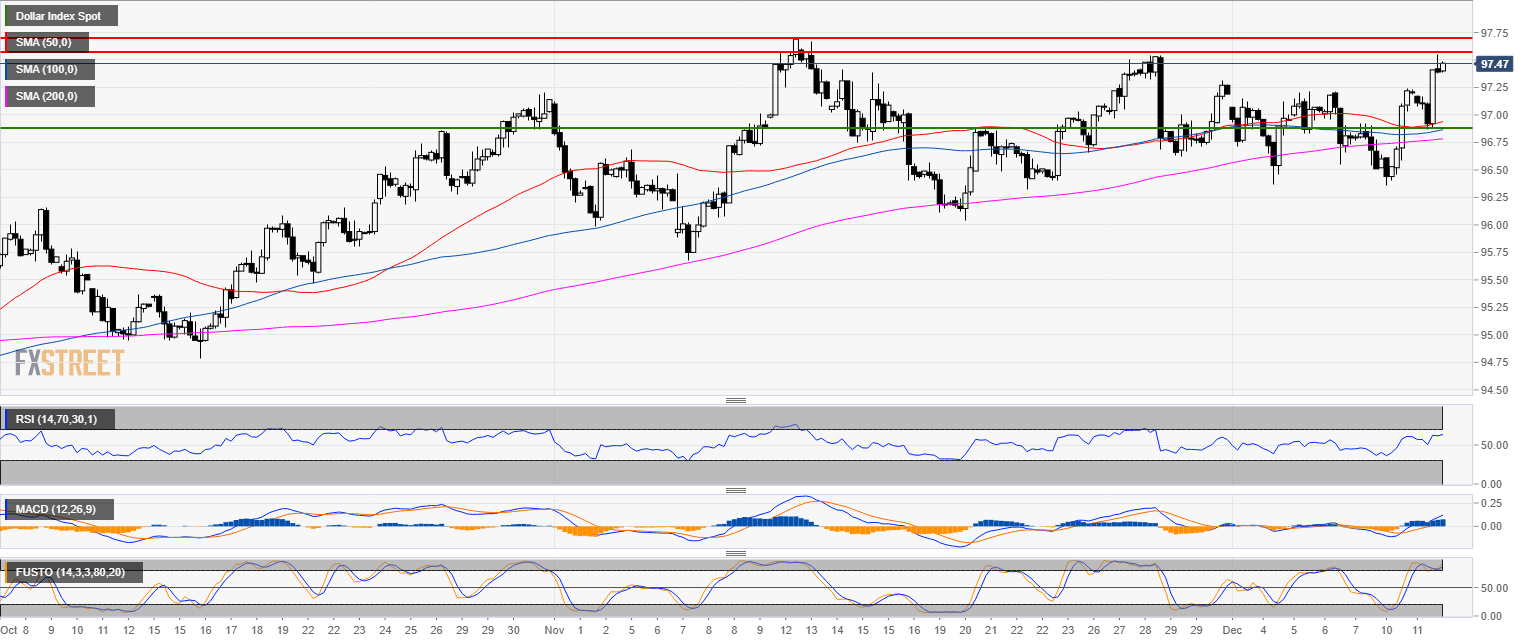
DXY 4-hour chart
- DXY is trading in a bull trend above its main SMAs.
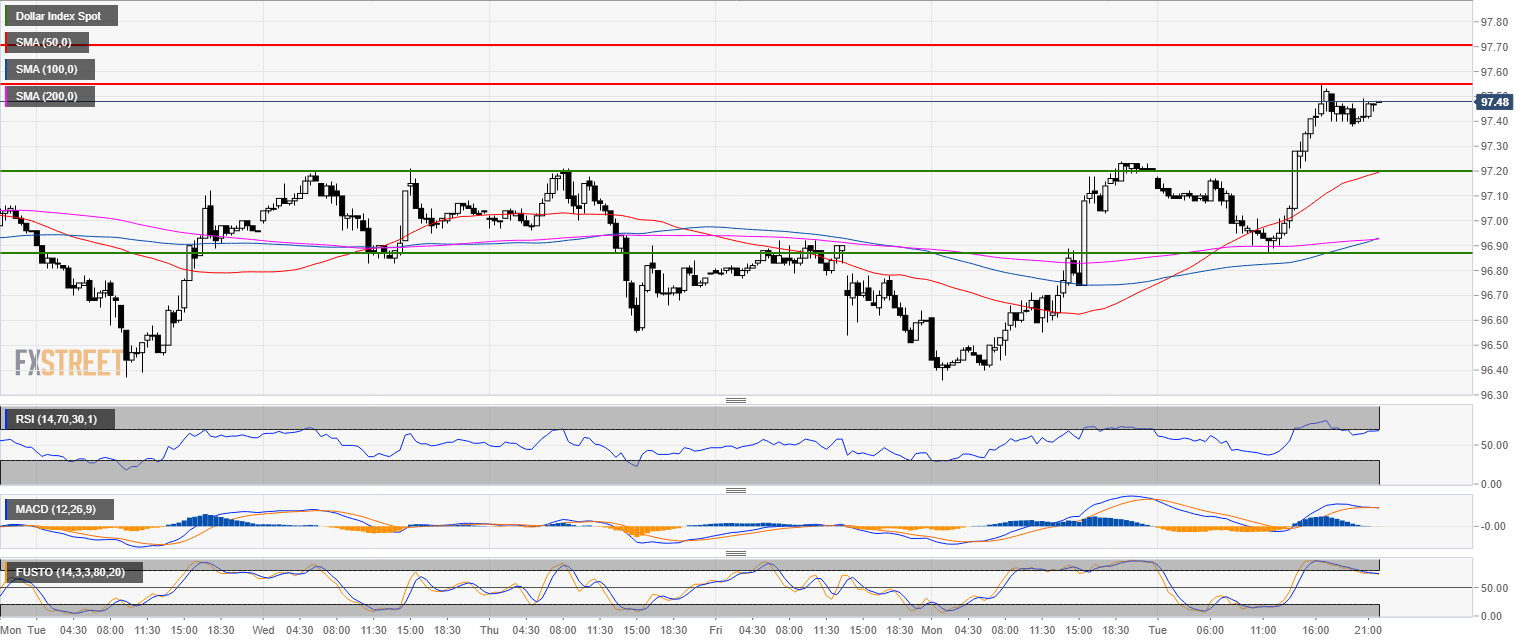
DXY 30-minute chart
- While the bull target is very close at 97.70 (2018 high) a correction down can see 97.20 and 96.90 as bear targets.
Additional key levels
Dollar Index Spot
Overview:
Today Last Price: 97.47
Today Daily change: 26 pips
Today Daily change %: 0.267%
Today Daily Open: 97.21
Trends:
Previous Daily SMA20: 96.88
Previous Daily SMA50: 96.41
Previous Daily SMA100: 95.74
Previous Daily SMA200: 94.1
Levels:
Previous Daily High: 97.24
Previous Daily Low: 96.36
Previous Weekly High: 97.21
Previous Weekly Low: 96.37
Previous Monthly High: 97.7
Previous Monthly Low: 95.68
Previous Daily Fibonacci 38.2%: 96.9
Previous Daily Fibonacci 61.8%: 96.7
Previous Daily Pivot Point S1: 96.63
Previous Daily Pivot Point S2: 96.06
Previous Daily Pivot Point S3: 95.75
Previous Daily Pivot Point R1: 97.51
Previous Daily Pivot Point R2: 97.82
Previous Daily Pivot Point R3: 98.39
