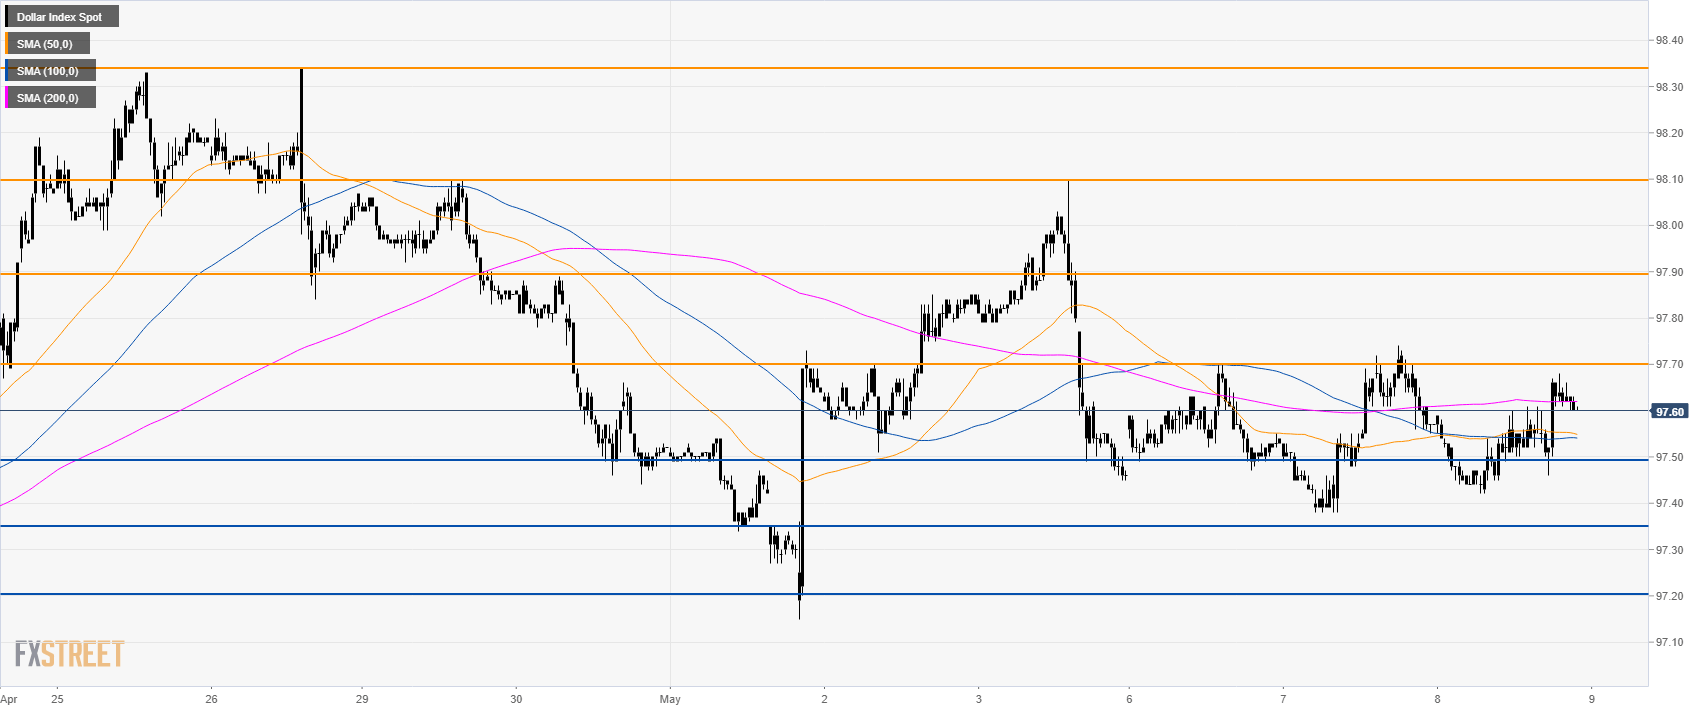
- Little to no progress has been made on Wednesday as the market is in wait-and-see mode.
- 97.70 is the key resistance to break for bulls as the 2019 high can be the next main target.
DXY daily chart
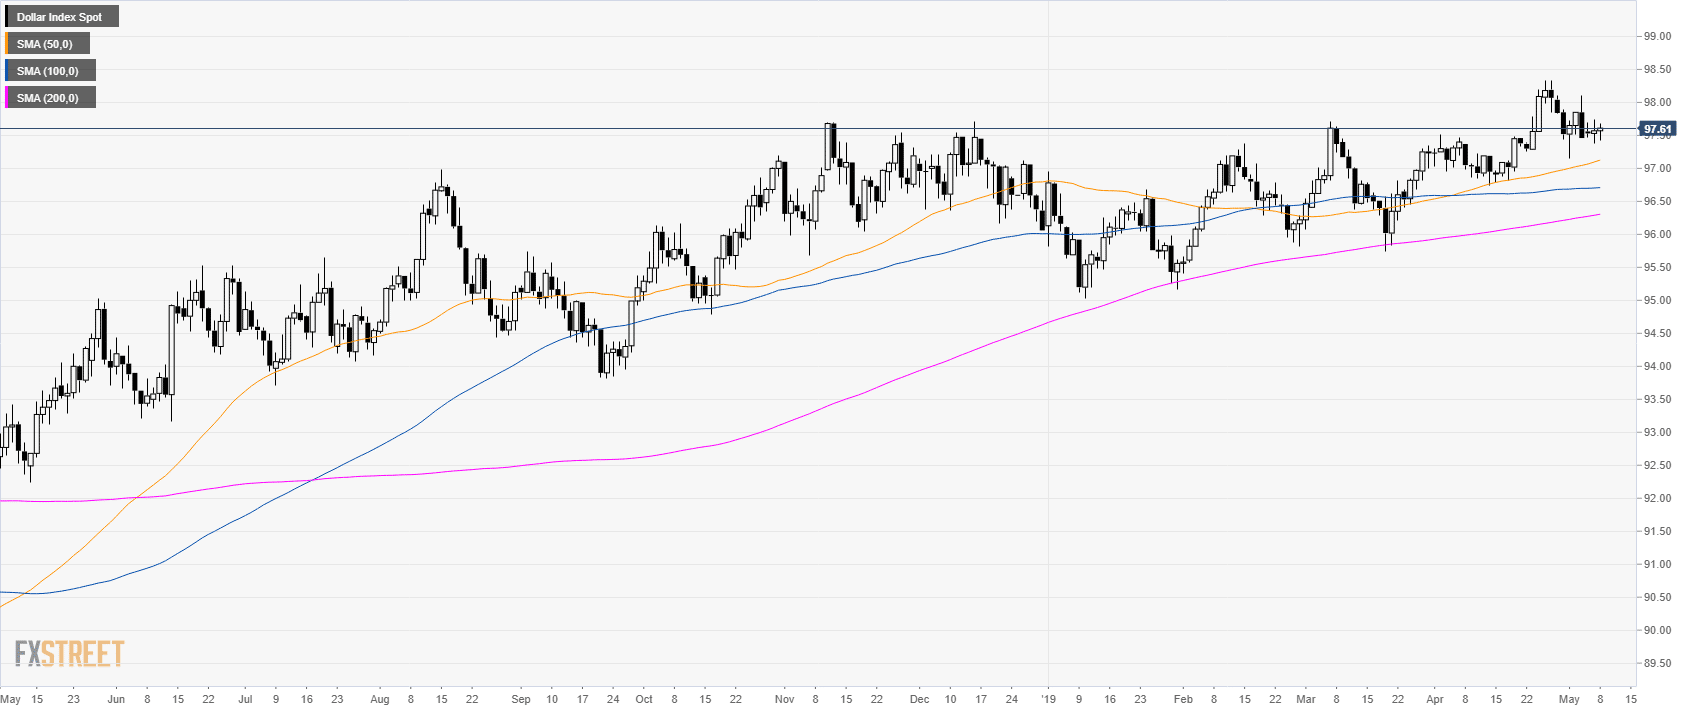
The US Dollar Index (DXY) is trading in a bull trend above its main simple moving averages (SMAs).

DXY 4-hour chart
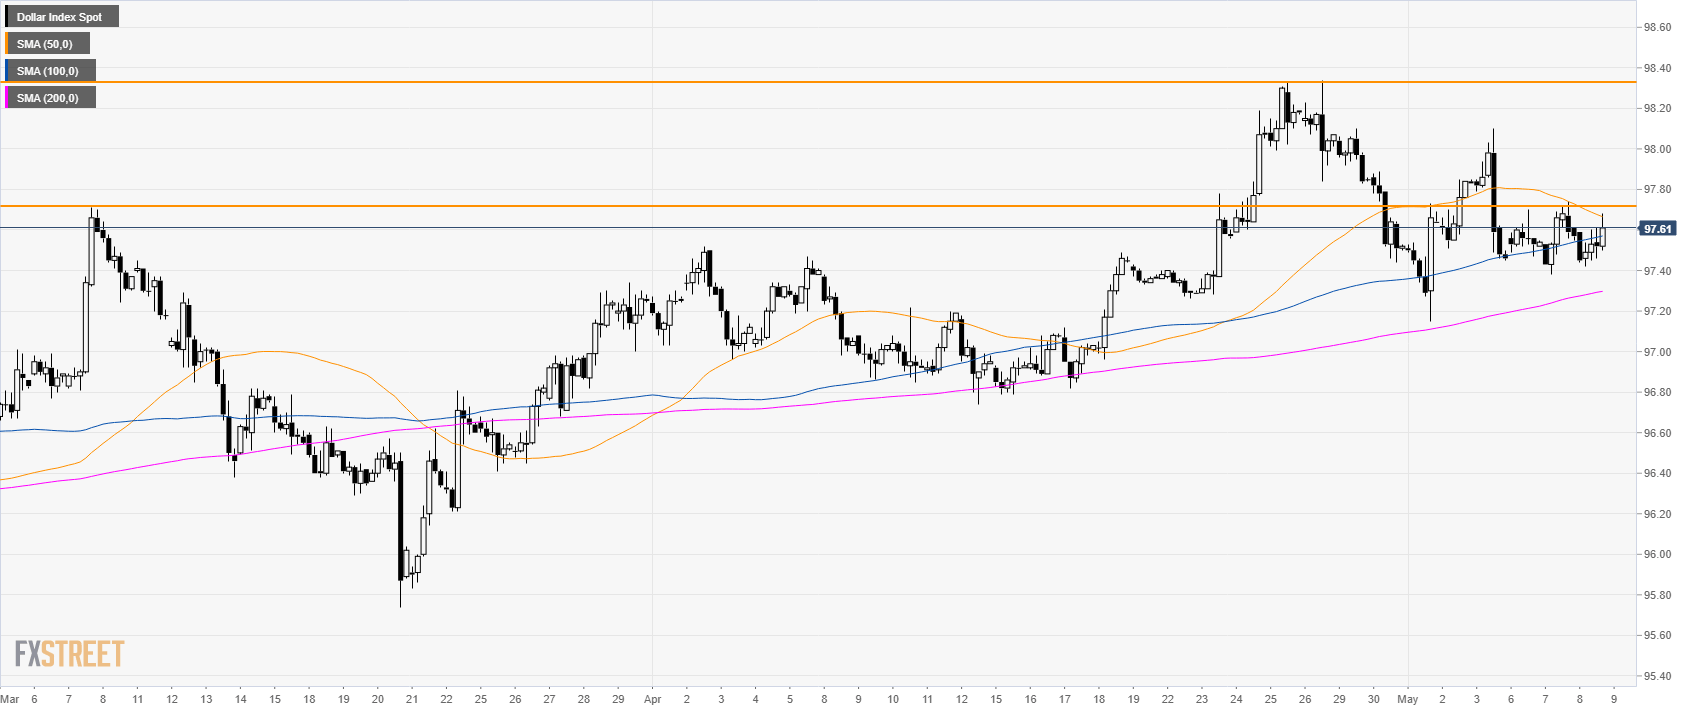
DXY is trading above its main SMAs suggesting bullish momentum in the medium-term.
97.70 continues to cap the shallow advances. This is a major resistance for bulls to beat.
98.38 level, the 2019 high, remain on the cards for bulls.
DXY 30-minute chart
A bullish break above 97.70 can see the index travel to 97.90, 98.10 and 98.34 level.
Support is seen at 97.50, 97.35 and 97.20 level.
Additional key levels