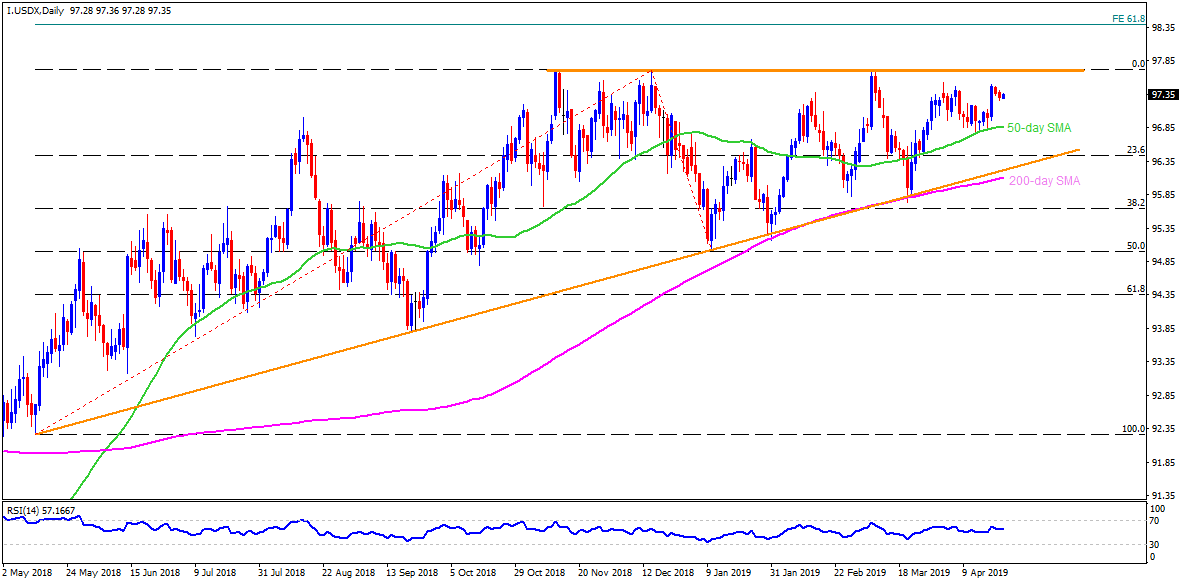
DXY daily chart
- Despite bouncing off 50-day simple moving average (SMA), the US Dollar Index couldn’t cross 97.50 and is presently witnessing pullback towards 97.20 nearby support during early Tuesday.
- On the break of 97.20, 50-day SMA level of 96.90 and 23.6% Fibonacci retracement of May – December advances, at 96.45, may gain sellers’ attention. However, nearly a year old ascending trend-line around 96.20 and 200-day SMA level of 96.10 might question the Bears afterward.
- Meanwhile, upside clearance of 97.50 opens the door for the gauge’s recovery to 97.70/75 area including multiple highs marked since November 2018. Given the quote’s rally past-97.75, 98.40 can lure the Bulls as it comprises 61.8% Fibonacci expansion (FE) level of May 2018 to January 2019 moves.
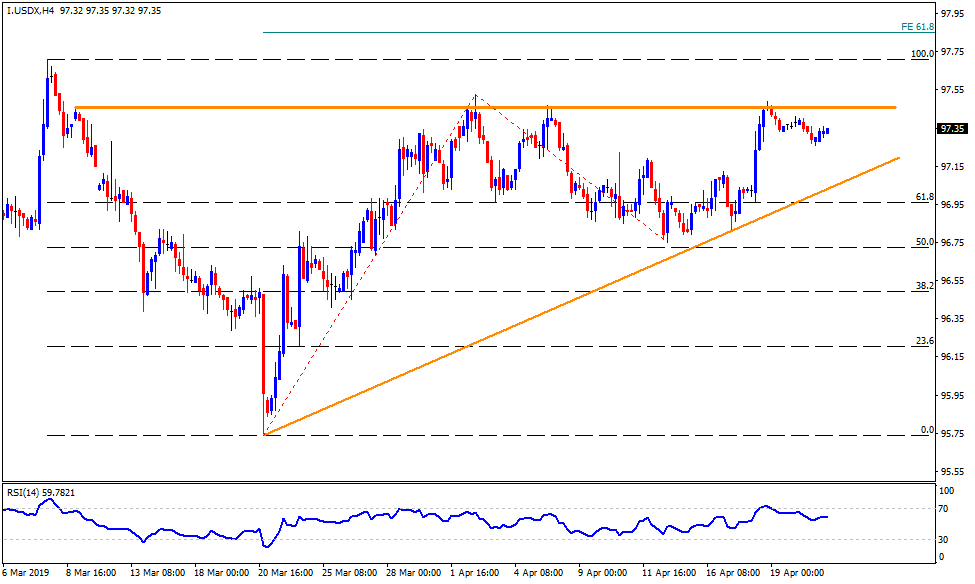
DXY 4-Hour chart
- 61.8% FE of March 20 to April 12 moves near 98.85 can act as additional upside resistance.
- An ascending support-line stretched since March 20 may offer extra rest-point to the prices near 97.00 during declines.
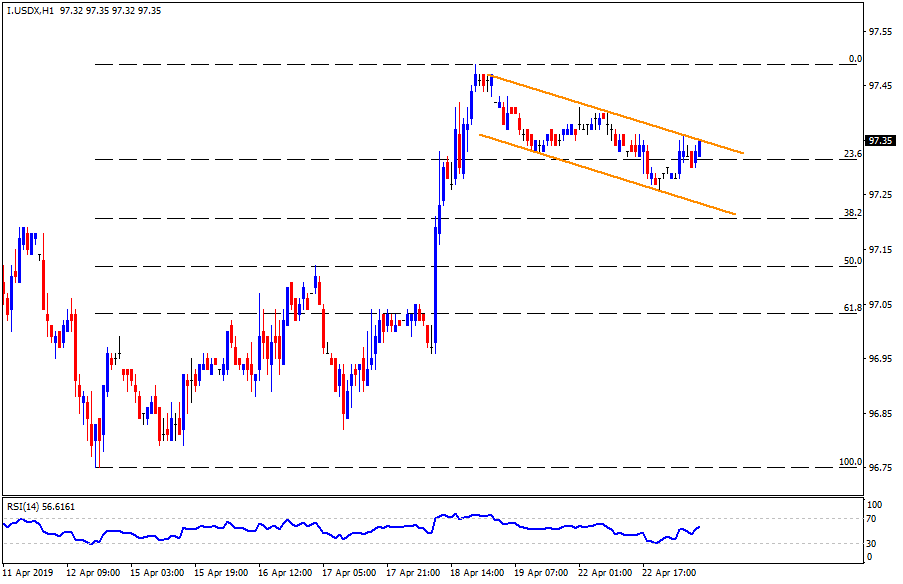
DXY hourly chart
- Short-term falling trend-channel portrays closest trading range between 97.35 and 97.20.