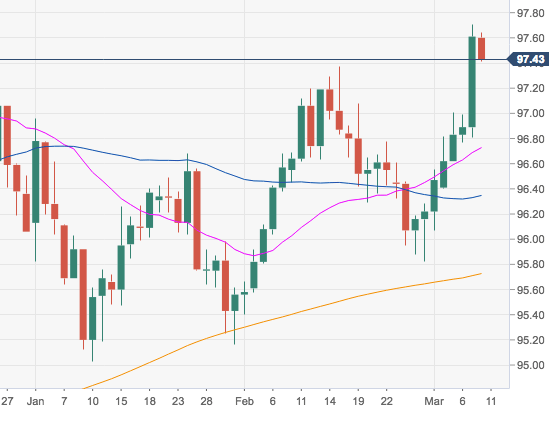
- The buying pressure around the greenback remains well and sound, although the index is partially fading yesterday’s advance to fresh 2019 highs in the 97.70/75 band.
- Further gains in DXY now targets the 98.00 neighbourhood, monthly highs seen in June 2017.
- The constructive stance in the buck should stay unchanged while above the critical 200-day SMA at 95.72.
DXY daily chart
Dollar Index Spot
Overview:
Today Last Price: 97.46
Today Daily change: 24 pips
Today Daily change %: -0.15%
Today Daily Open: 97.61
Trends:
Daily SMA20: 96.69
Daily SMA50: 96.29
Daily SMA100: 96.53
Daily SMA200: 95.71
Levels:
Previous Daily High: 97.71
Previous Daily Low: 96.81
Previous Weekly High: 96.61
Previous Weekly Low: 95.82
Previous Monthly High: 97.37
Previous Monthly Low: 95.4
Daily Fibonacci 38.2%: 97.37
Daily Fibonacci 61.8%: 97.15
Daily Pivot Point S1: 97.04
Daily Pivot Point S2: 96.48
Daily Pivot Point S3: 96.14
Daily Pivot Point R1: 97.94
Daily Pivot Point R2: 98.28
Daily Pivot Point R3: 98.84
