- ISM Manufacturing PMI drops to 10-year lows and the Greenback fell.
- DXY is retracing, from a new 2019 high, towards the 99.00 handle.
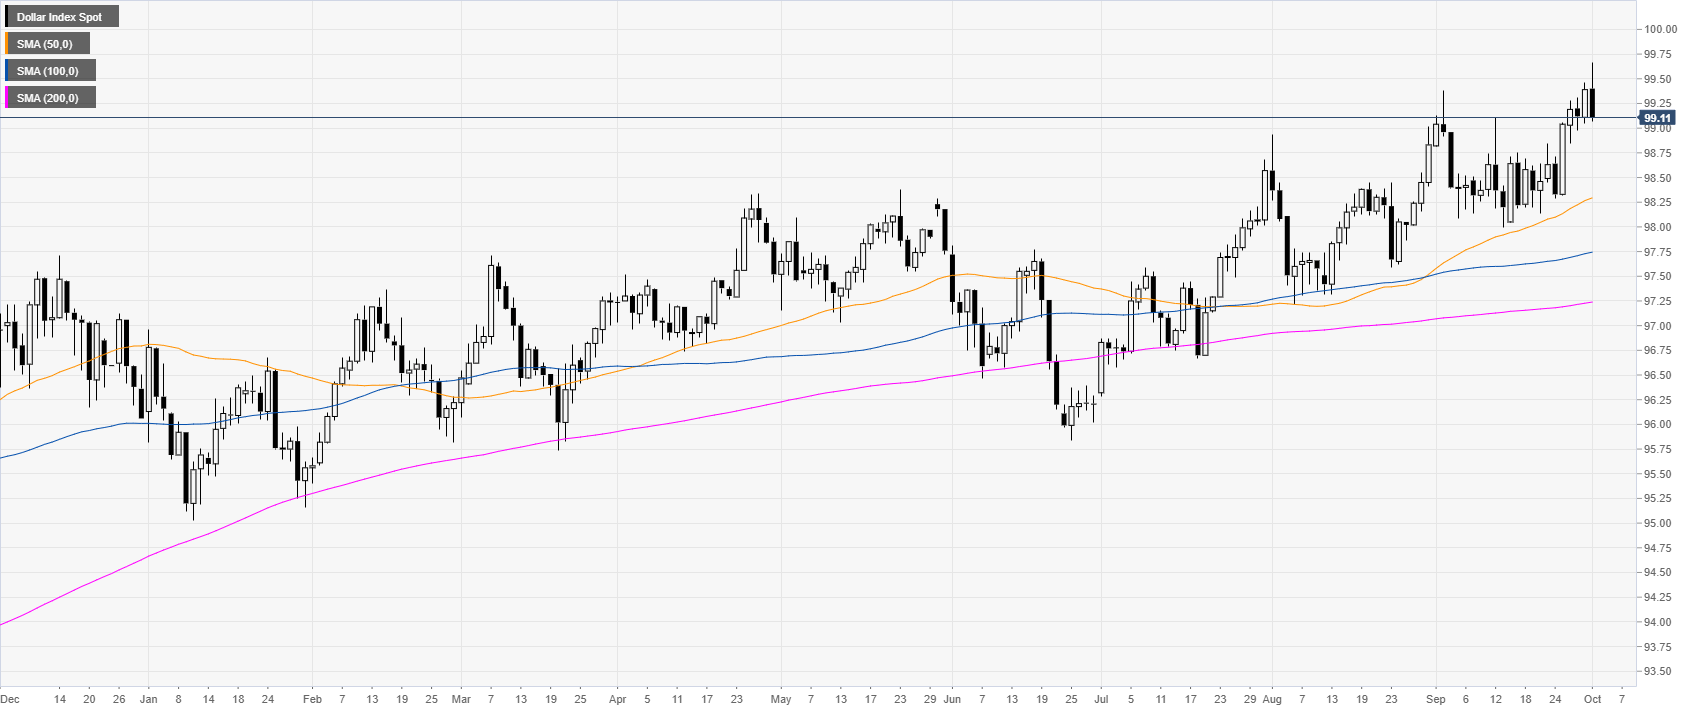
DXY daily chart
DXY (US Dollar Index) is trading a bull trend above its main daily simple moving averages (DSMAs). The market almost hit the 2019 high at 99.38 before retreating slightly. In the New York session, the ISM Manufacturing PMI came in below expectations at 47.8 vs. 50.1 forecast. This was the worst reading since 2009 and sent the Index lower.
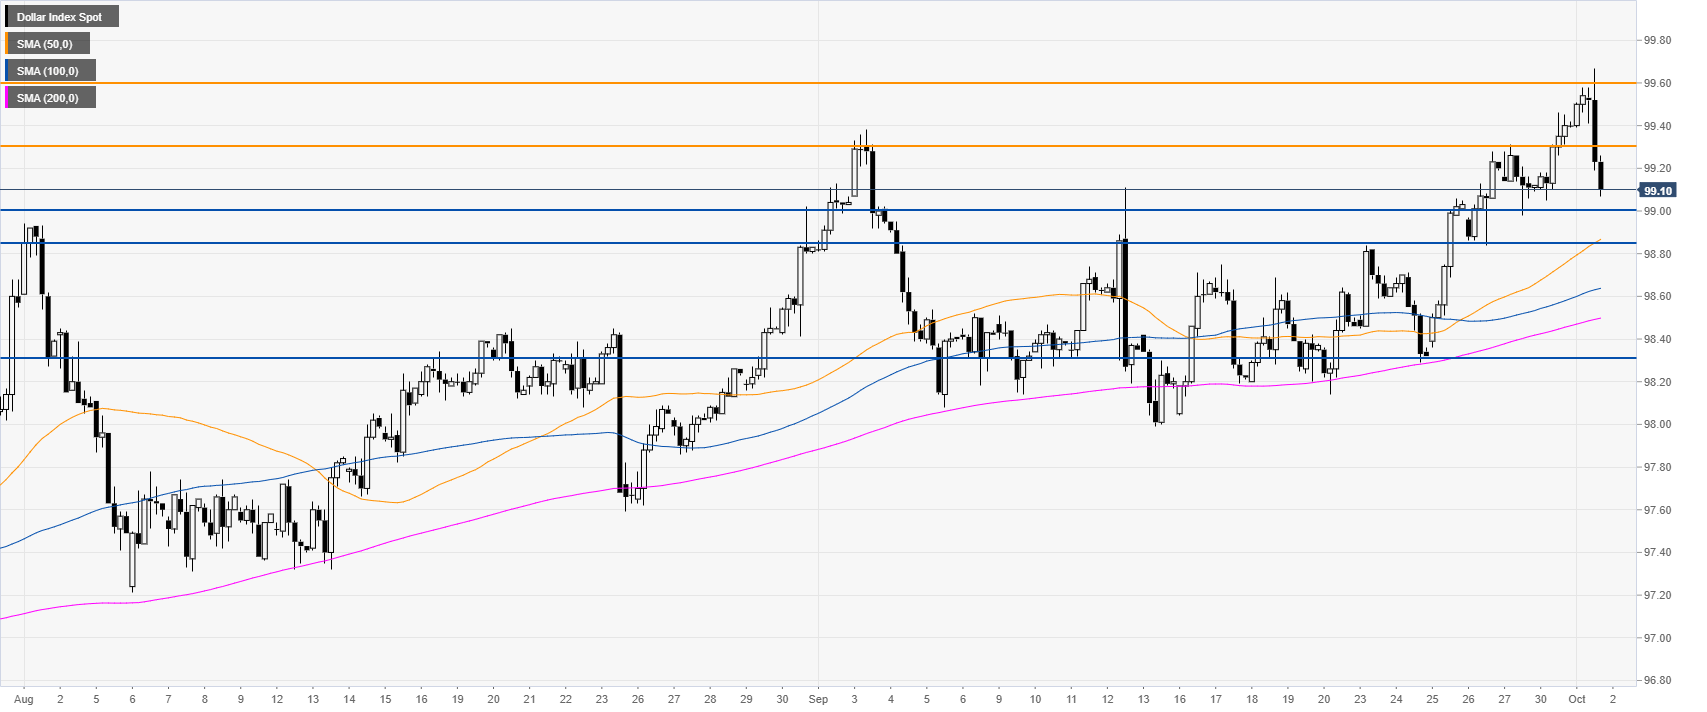
DXY four-hour chart
DXY is pulling back down after hitting a new 2019 high at 99.67. The market is retracing potentially towards the 99.00 and 98.85 support. A break below 98.85 can expose 98.30 on the way down.
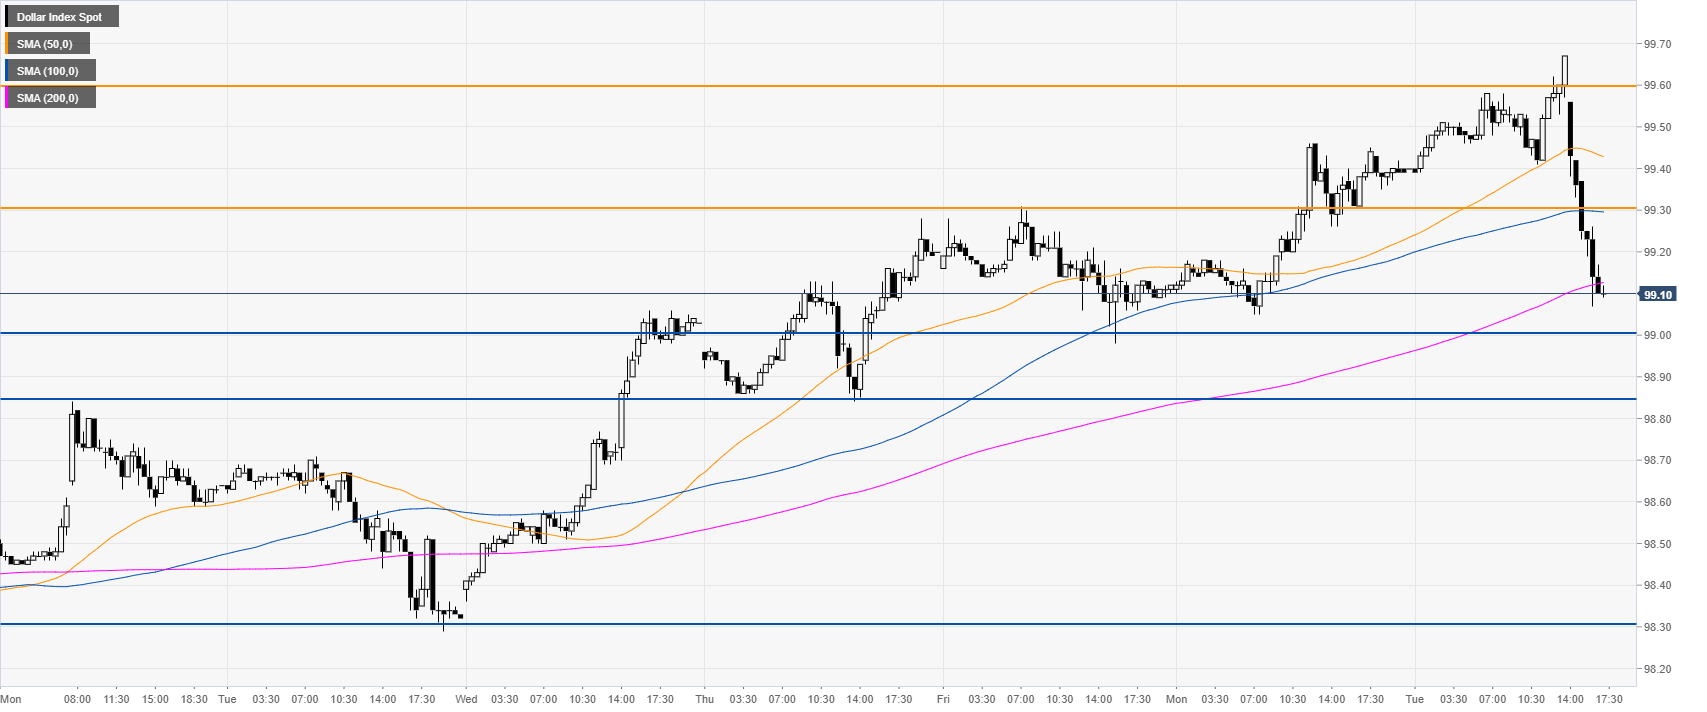
DXY 30-minute chart
DXY is challenging the 200 SMA, suggesting a neutral/bearish bias in the short term. Immediate resistance is seen at the 99.30 price level.
Additional key levels
