- DXY (US Dollar Index) is about to close at its lowest since July 22.
- The market is in a tight trading range just above its 50 DSMA.
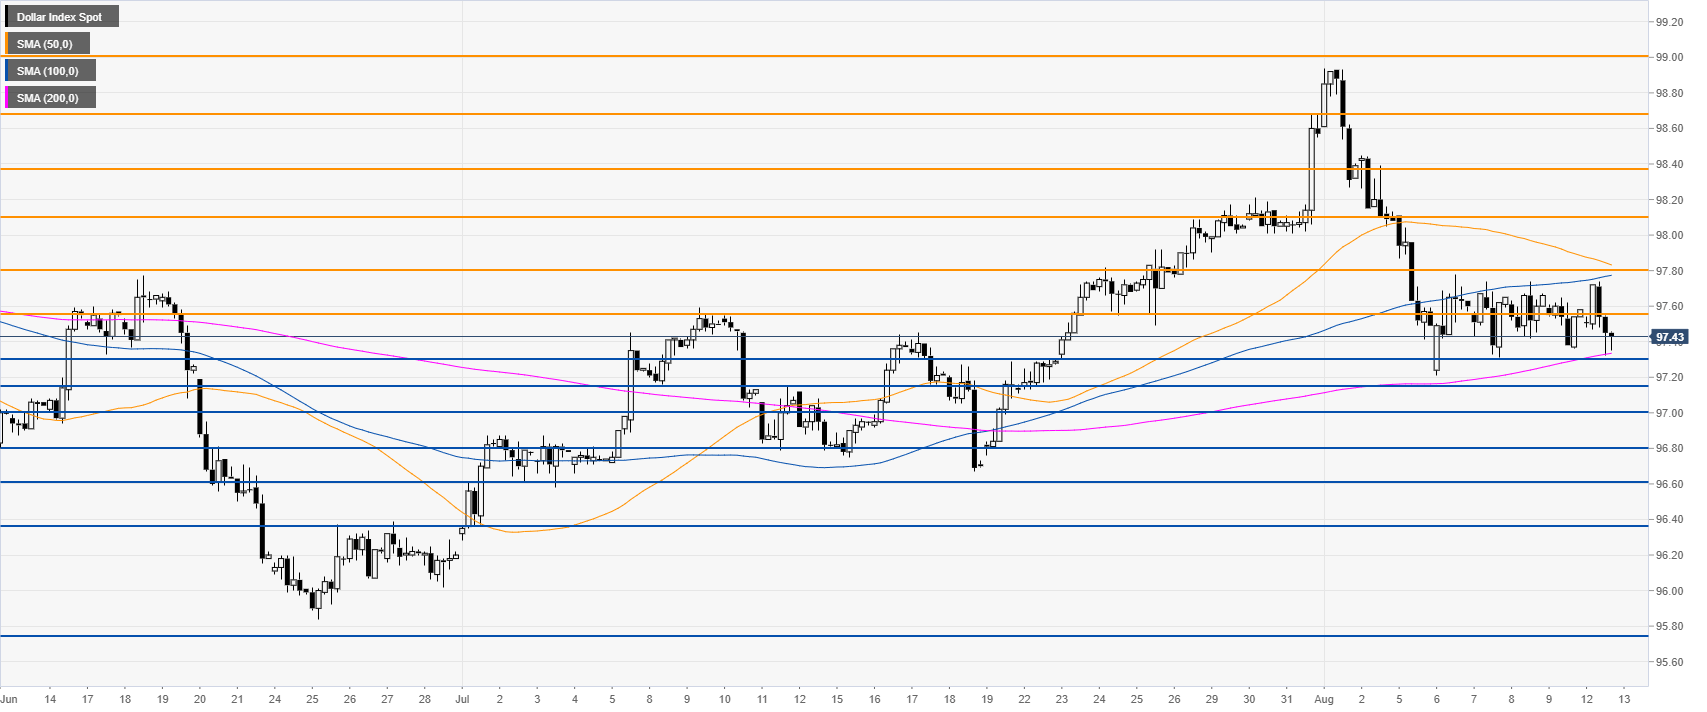
DXY daily chart
DXY (US Dollar Index) is trading in a bull trend above its main daily simple moving averages (DSMAs). DXY keeps the consolidation theme unchanged. However, the market is about to close at its lowest since July 22.

DXY 4-hour chart
DXY found support near the 96.30 level above the 200 SMA. However, the buyers will need a clear break above the 97.80 resistance to target the 98.10 level and the 50 SMA. Further up, bulls will look at the 98.36 resistance.
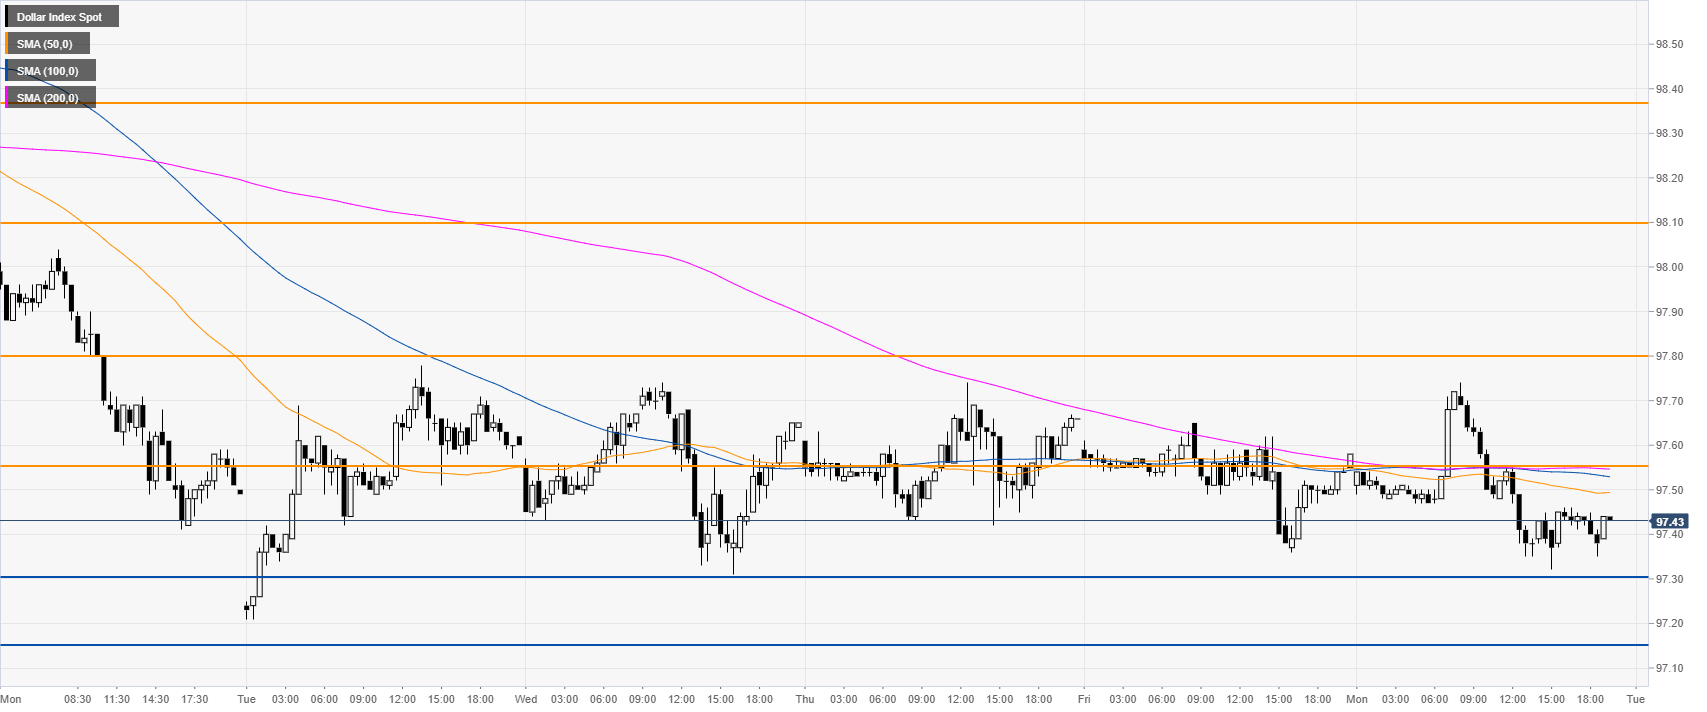
DXY 30-minute chart
The greenback is under pressure below its main SMAs. Immediate support is at 97.30. However, a daily close below 97.15 could be seen as a potential bearish continuation towards the 97.00 figure.
Additional key levels
