- DXY is ending the week with a slump to the 98.00 handle.
- The next relevant support is seen at the 97.80 level.
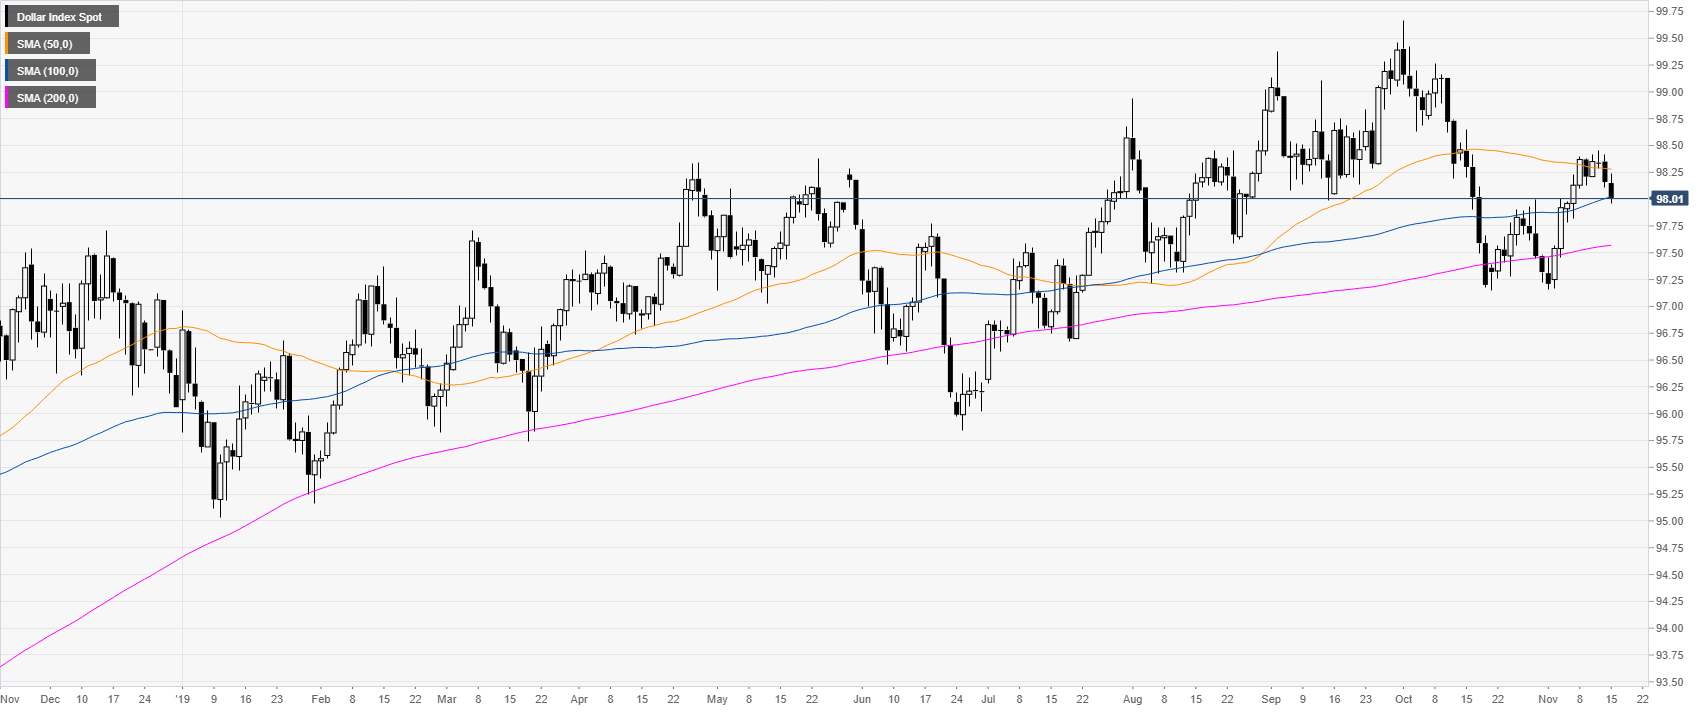
DXY daily chart
DXY (US Dollar Index) is trading in a bull trend above the main daily simple moving averages (DMAs). This Friday the Greenback declined to its lowest in five-days.
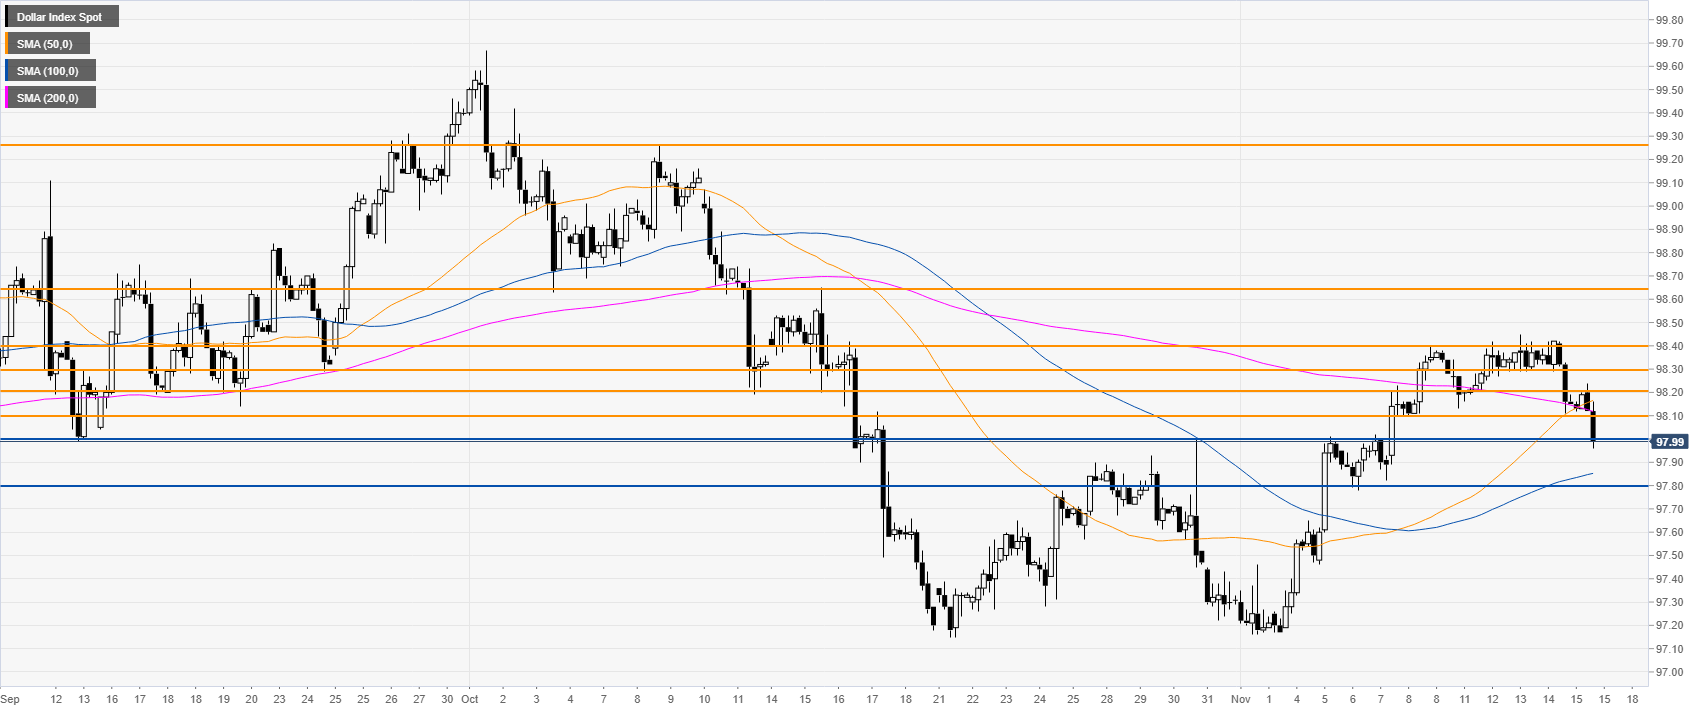
DXY 4-hour chart
DXY is trading below the 50 and 200 SMAs, suggesting a bearish bias in the medium term. A break below the 98.00 handle can lead to further weakness to the 97.80 support level.
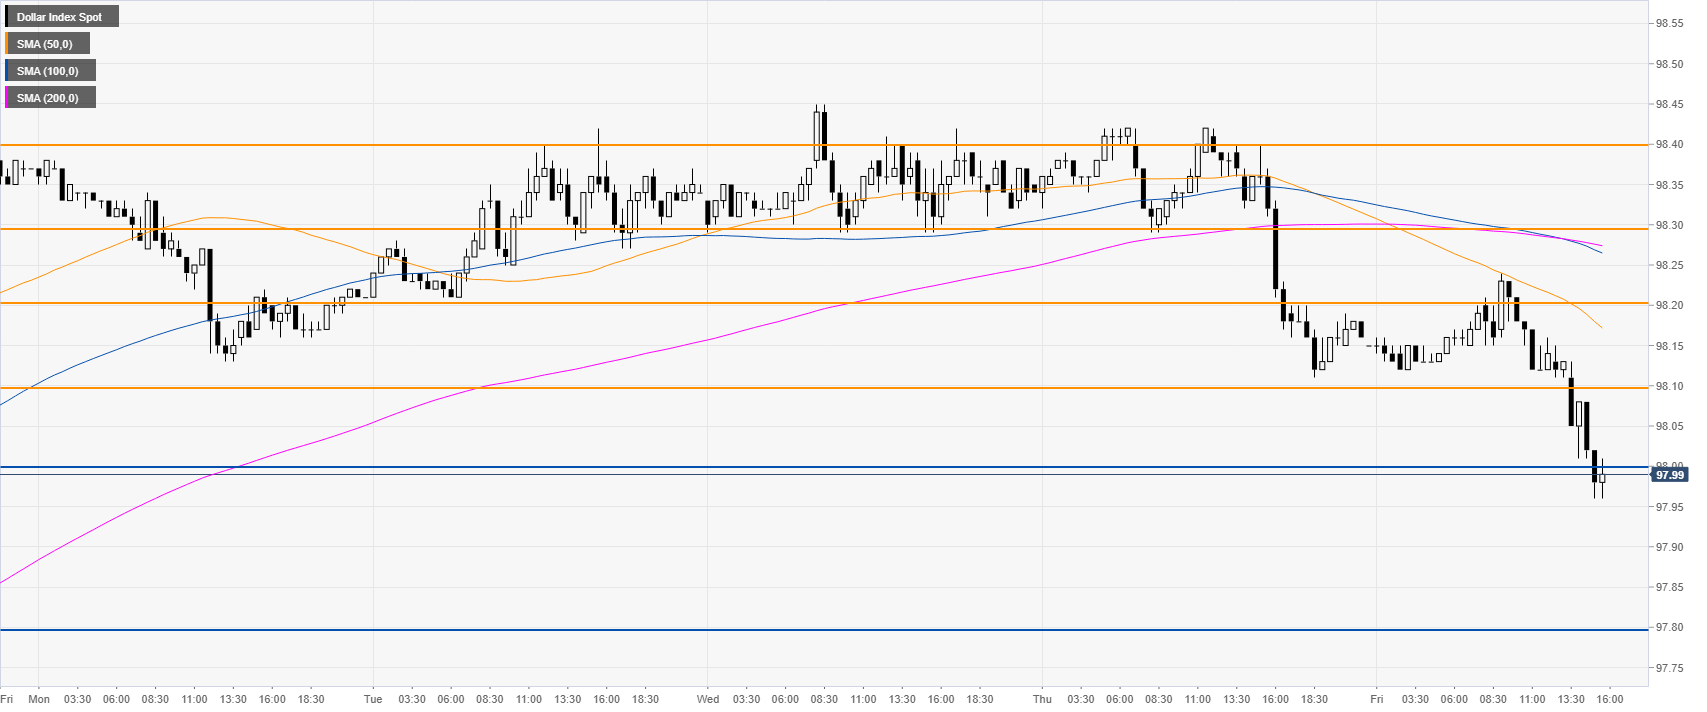
DXY 30-minute chart
DXY is down for the second consecutive day while trading below its main SMAs. The bias is currently bearish in the short term and resistances are seen at the 98.00, 98.10 and 98.20 levels.
Additional key levels
