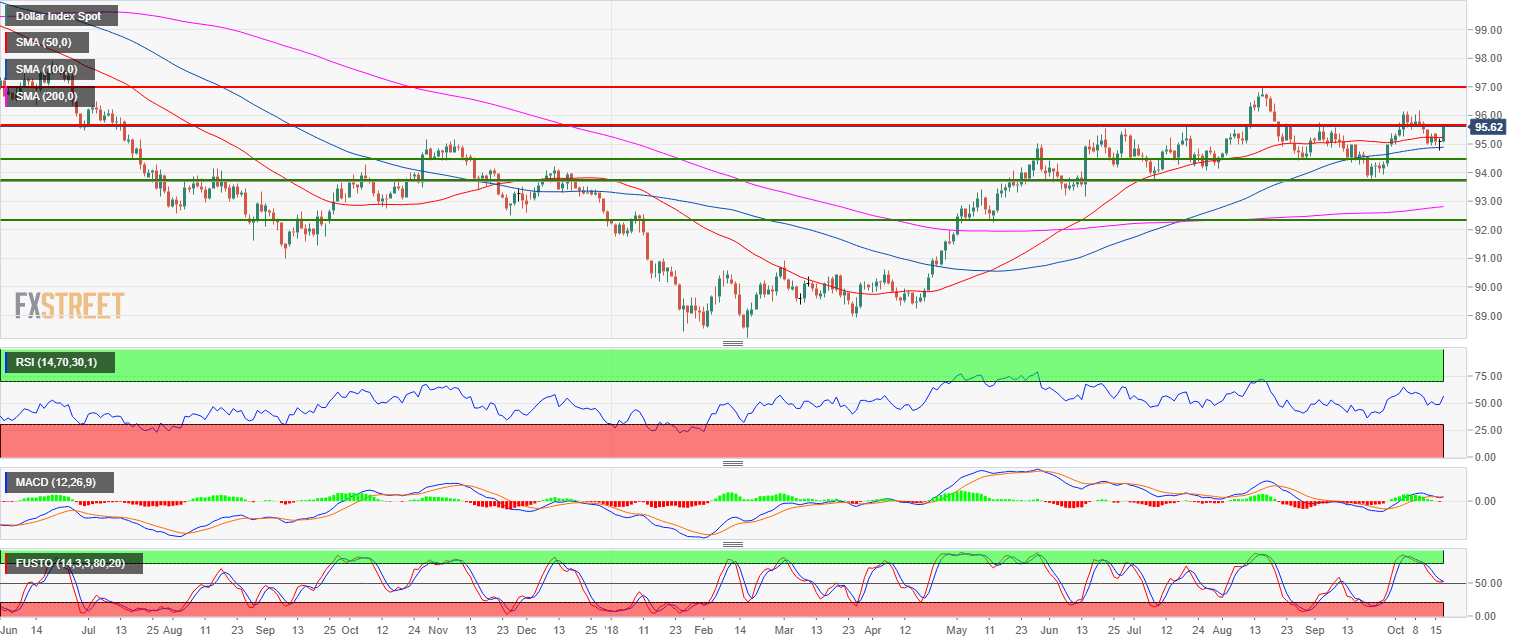
- The US Dollar Index (DXY) moved sharply higher this Wednesday as it is set to close the day just below 95.65 multi-month resistance.
- DXY is trading above its relatively flat 50, 100 and 200-period simple moving averages (SMA) while the RSI and Stochastic indicators are trading above the 50 line which is rather constructive for bulls.
- A break above 95.65 on a daily closing basis would be seen as a sign of strength by the bulls. The main target to the upside is the 2018 high at the 97.00 figure.
DXY daily chart
Spot rate: 95.63
Relative change: 0.57%
High: 95.63
Low: 95.06
Trend: Bullish
Resistance 1: 95.65 multi-month resistance (key level)
Resistance 2: 96.00 figure
Resistance 3: 96.41 August 20 high
Resistance 4: 97.00 current 2018 high
Support 1: 95.52 August 6 high
Support 2: 95.24 July 13 high
Support 3: 95.00 figure
Support 4: 94.91 July 27 high
Support 5: 94.43 August 28 swing low
Support 6: 93.81 September 21 swing low (key level)
