- DXY broke above the 98.00 handle helped by better-than-expected US data.
- The level to beat for bulls is the 98.20 and 98.40 price levels.
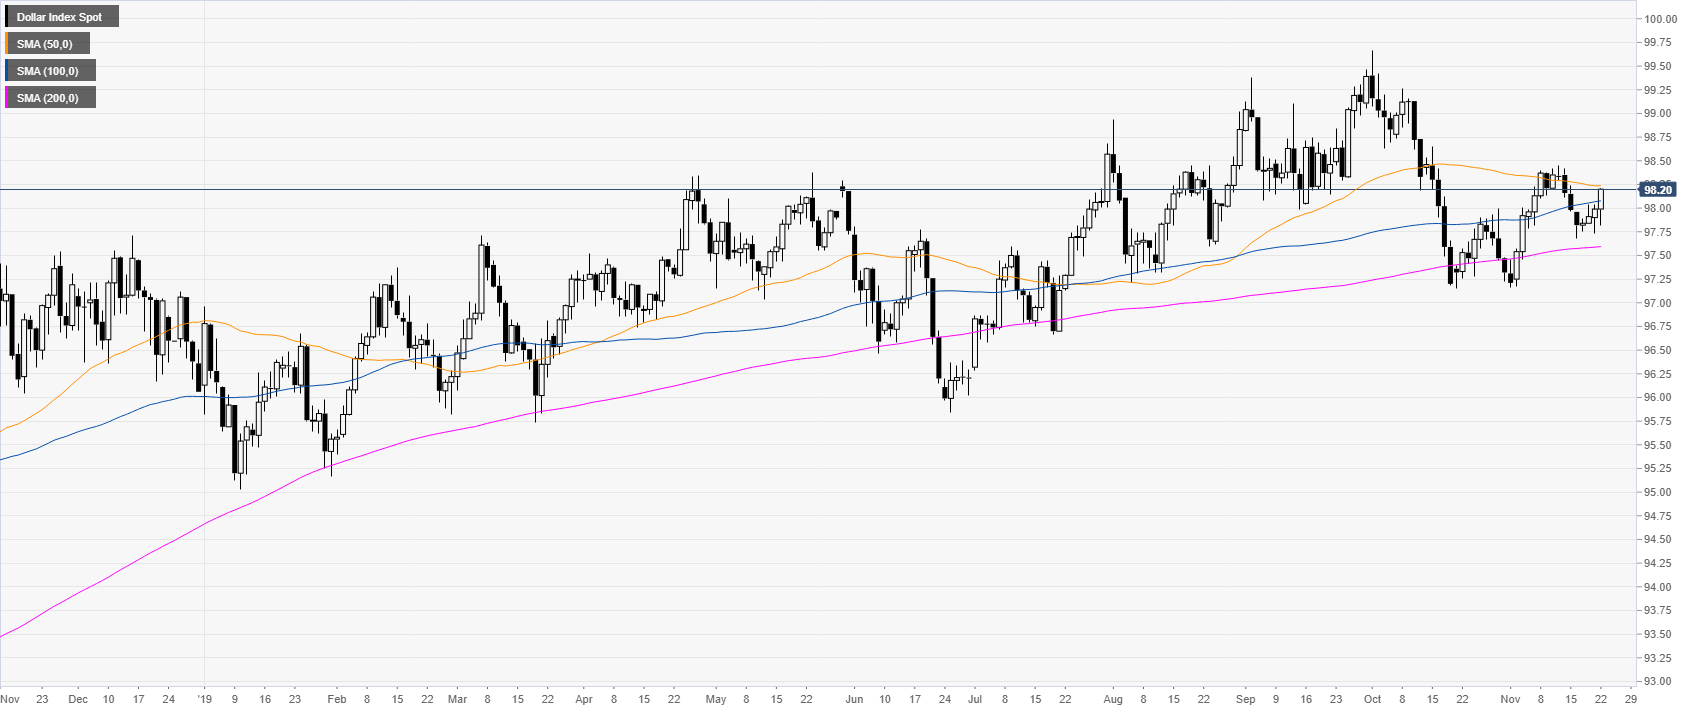
DXY daily chart
DXY (US Dollar Index) is trading in a bull trend above the 100/200-day simple moving average (DMA). This Friday, the greenback is trading at fresh weekly highs.
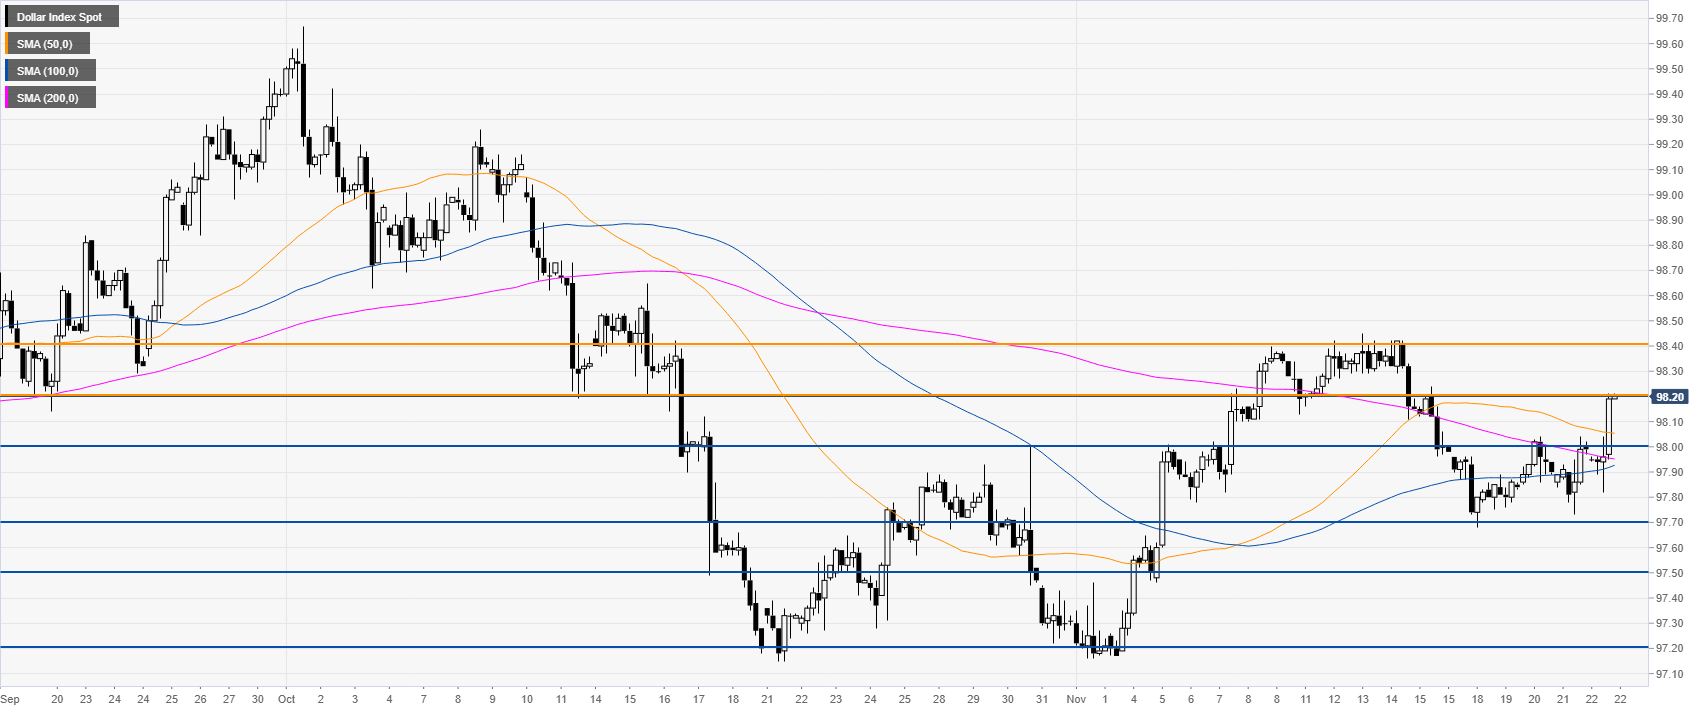
DXY 4-hour chart
DXY broke above the 98.00 handle and reached the 98.20 resistance as expected. If the buyers keep the pressure on the next level of resistance is seen at the 98.40 level, near the November highs.
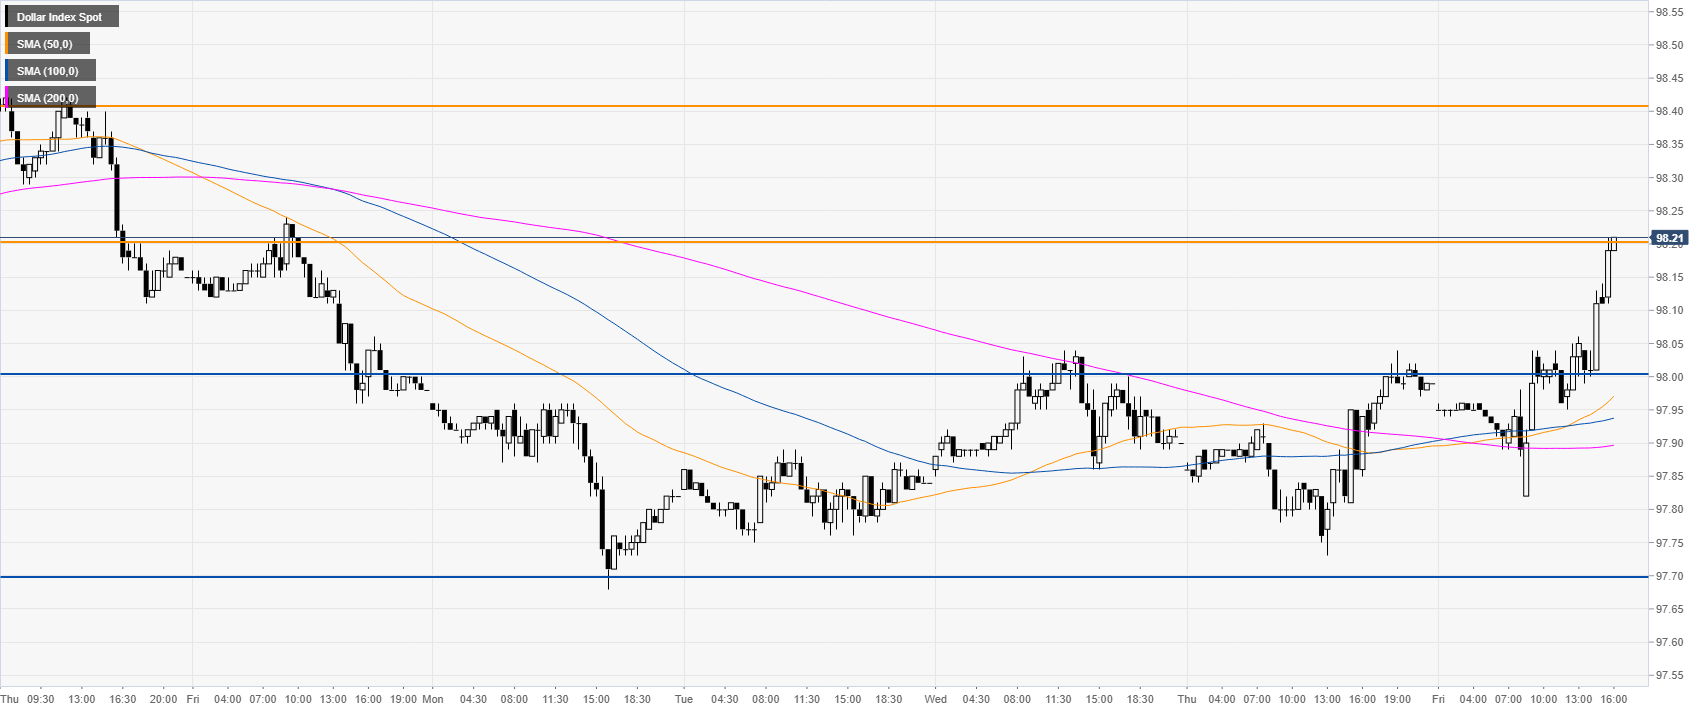
DXY 30-minute chart
The greenback is trading above the main SMAs, suggesting a bullish bias in the near term. Support is seen at the 98.00 and 97.70 level.
Additional key levels
