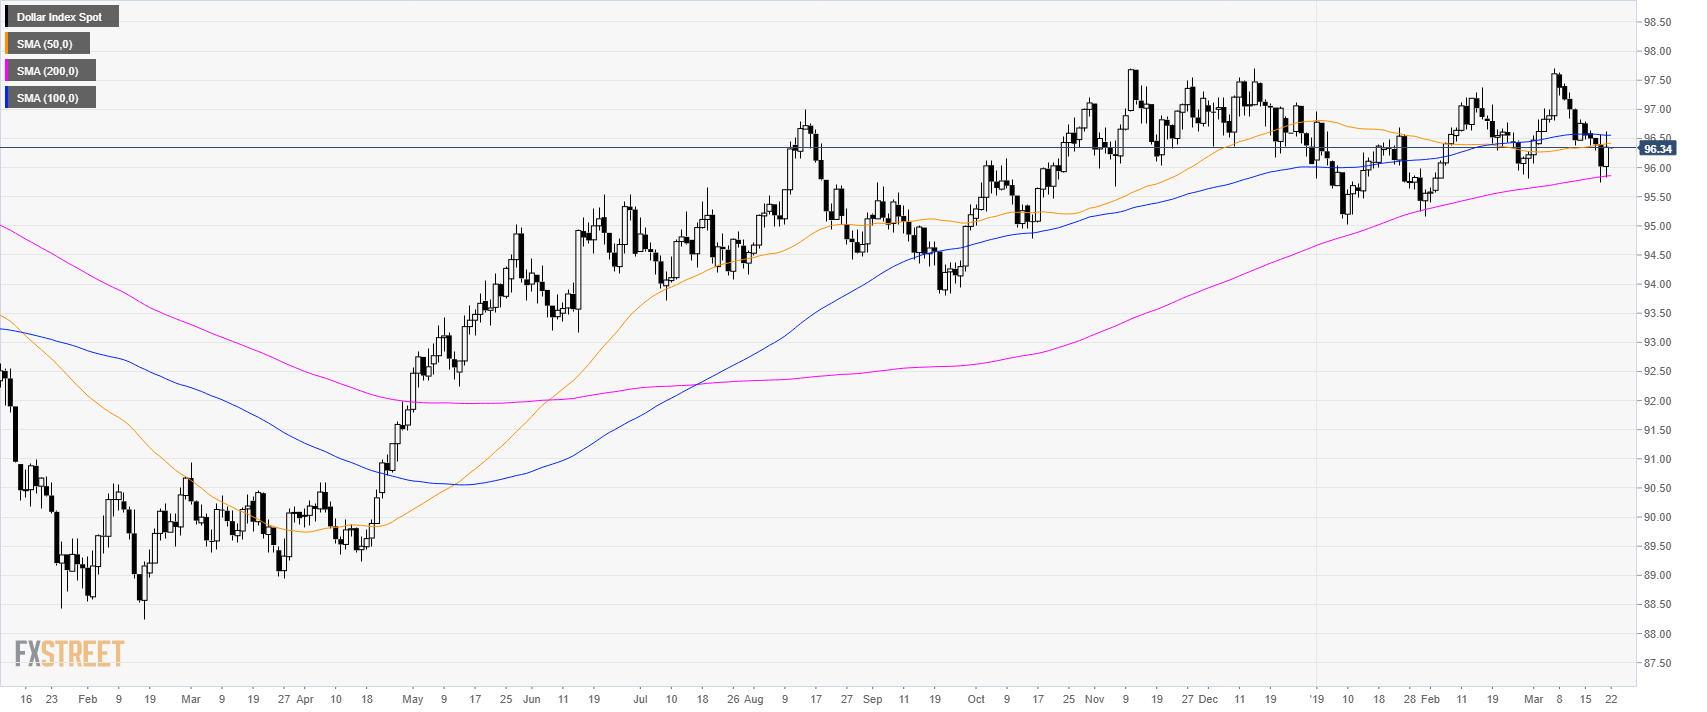
DXY daily chart
- The US Dollar Index (DXY) is trading in a bull trend above its 200-day simple moving average (SMA).
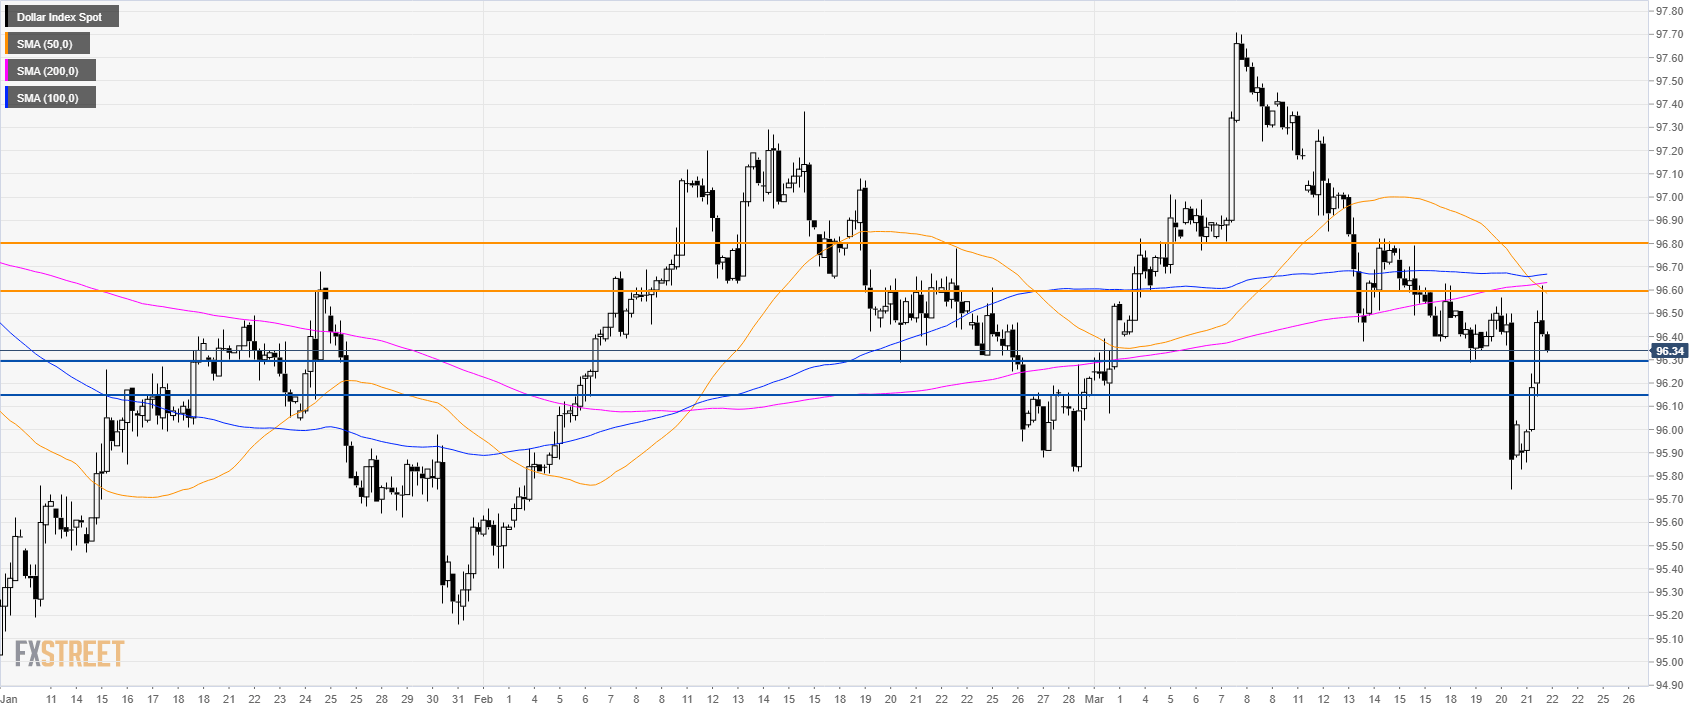
DXY 4-hour chart
- DXY is trading below its main SMAs suggesting bearish momentum in the medium-term.
- Support is at 96.30 and 96.15.
- To the upside, resistance is seen at 96.60 and 96.80 level.
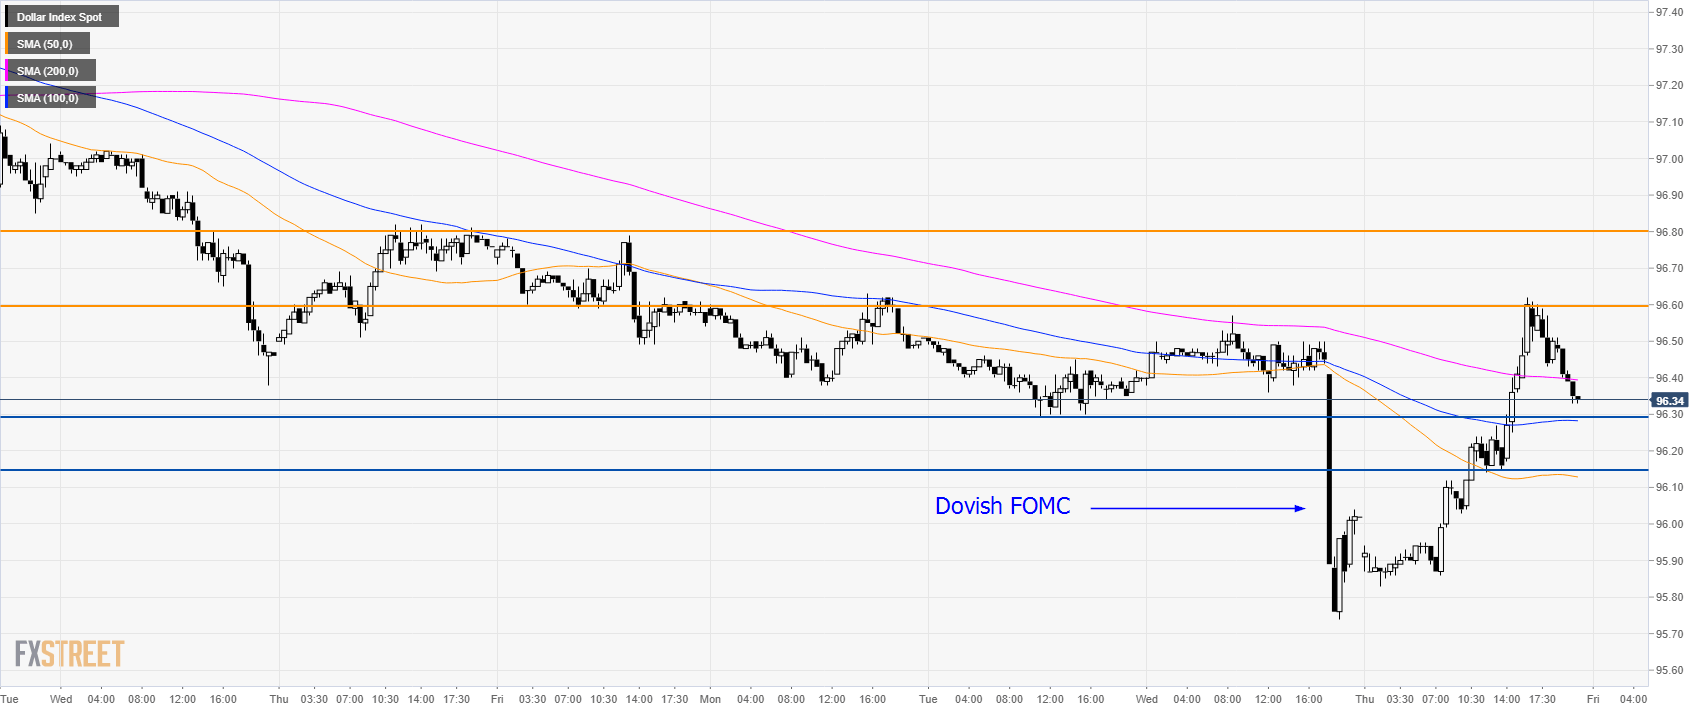
DXY 30-minute chart
- DXY is trading between the 100 and 200 SMAs suggesting a consolidation phase in the short-term.
- On Wednesday the FOMC was much more dovish than expected leading to a huge drop in the Dollar, however, bulls have already erased the loss this Thursday.
Additional key levels
