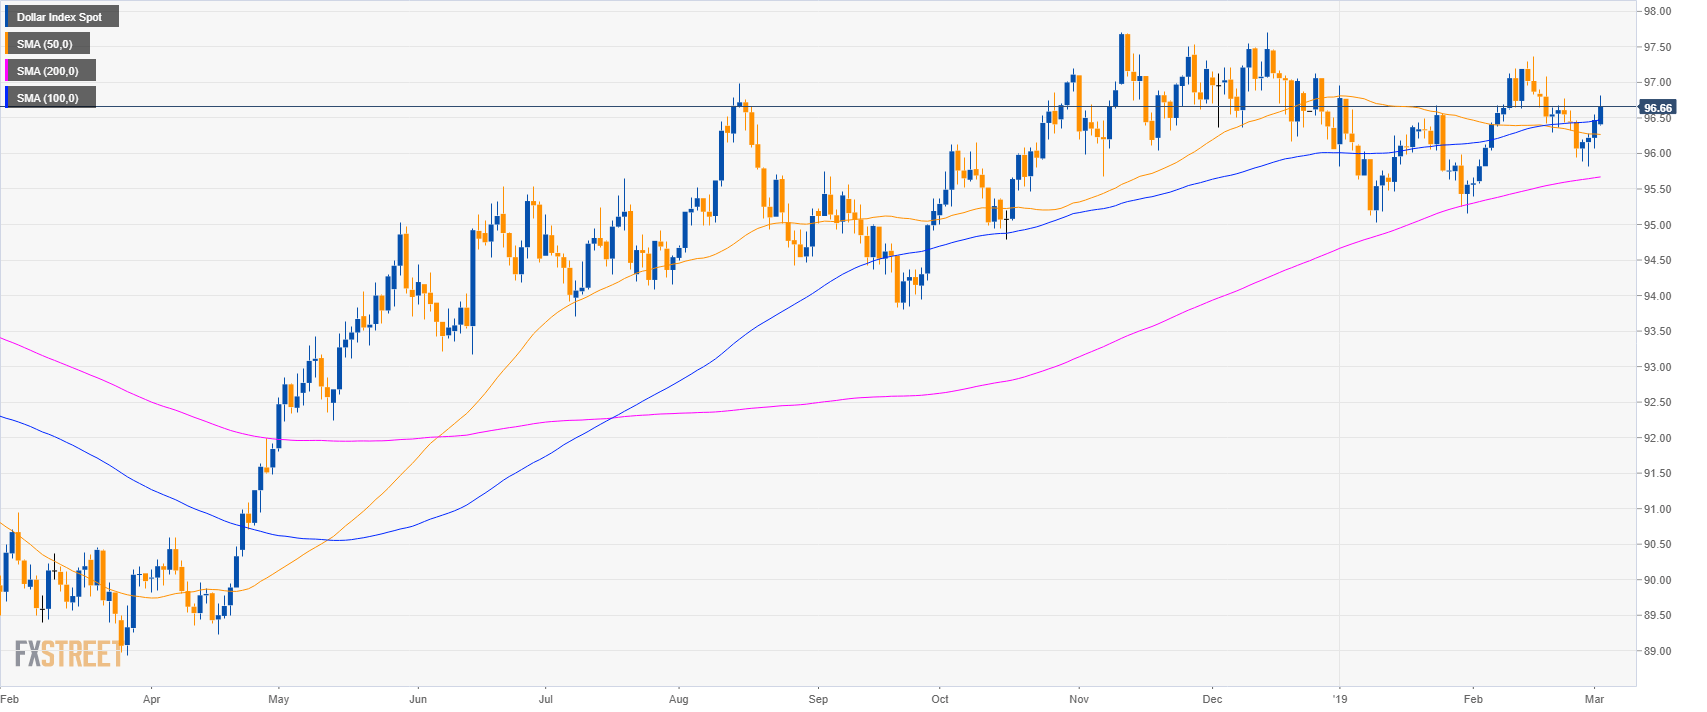
DXY daily chart
- The US Dollar Index (DXY) is trading in a bull trend above its main simple moving averages (SMAs).
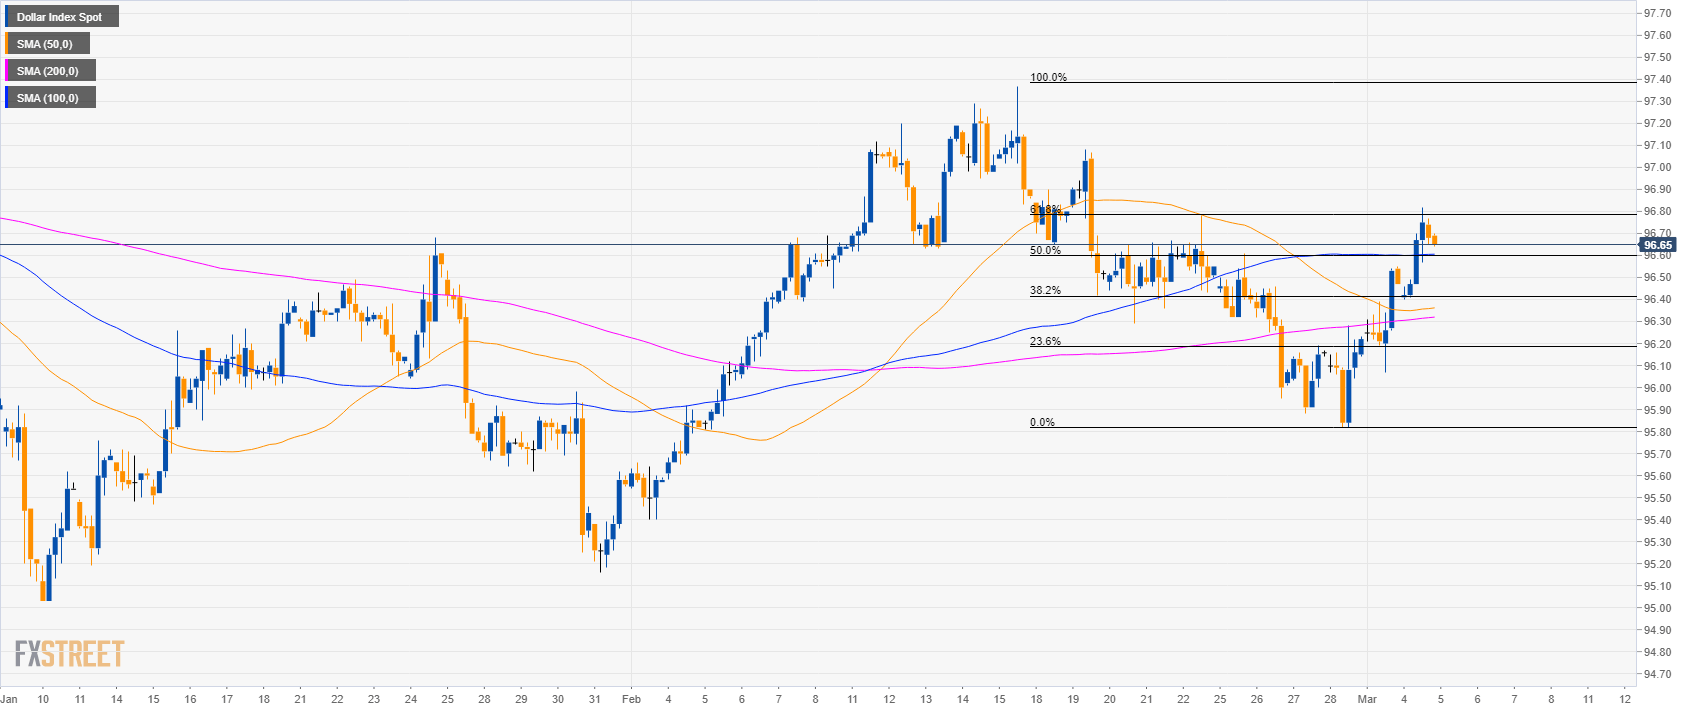
DXY 4-hour chart
- DXY reached the 61.8% Fibonacci retracement suggesting a potential pullback down in the medium-term.
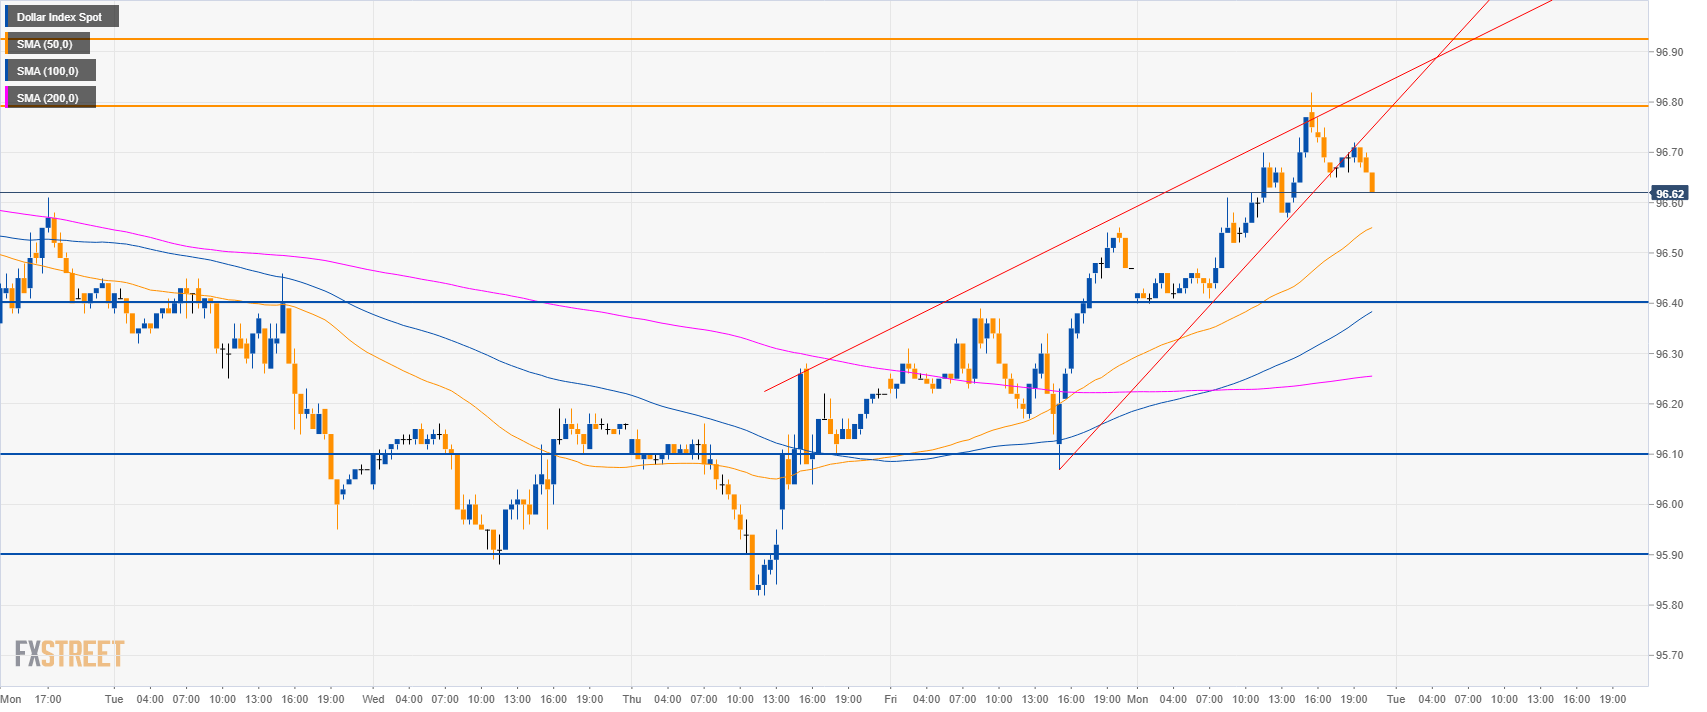
DXY 30-minute chart
- DXY is in a bearish wedge pattern. However, the bull momentum is still strong and traders might still drive the market to 96.93 resistance before a meaningful move down.
- To the downside, support is at 96.40, 96.10 and 95.90 level.
Additional key levels
Dollar Index Spot
Overview:
Today Last Price: 96.66
Today Daily change: 19 ticks
Today Daily change %: 0.20%
Today Daily Open: 96.47
Trends:
Daily SMA20: 96.54
Daily SMA50: 96.27
Daily SMA100: 96.46
Daily SMA200: 95.66
Levels:
Previous Daily High: 96.55
Previous Daily Low: 96.07
Previous Weekly High: 96.61
Previous Weekly Low: 95.82
Previous Monthly High: 97.37
Previous Monthly Low: 95.4
Daily Fibonacci 38.2%: 96.37
Daily Fibonacci 61.8%: 96.25
Daily Pivot Point S1: 96.18
Daily Pivot Point S2: 95.88
Daily Pivot Point S3: 95.7
Daily Pivot Point R1: 96.66
Daily Pivot Point R2: 96.84
Daily Pivot Point R3: 97.14
