- DXY is trading at daily highs challenging the 98.40 resistance.
- The level to beat for buyers is the 98.40 resistance level.
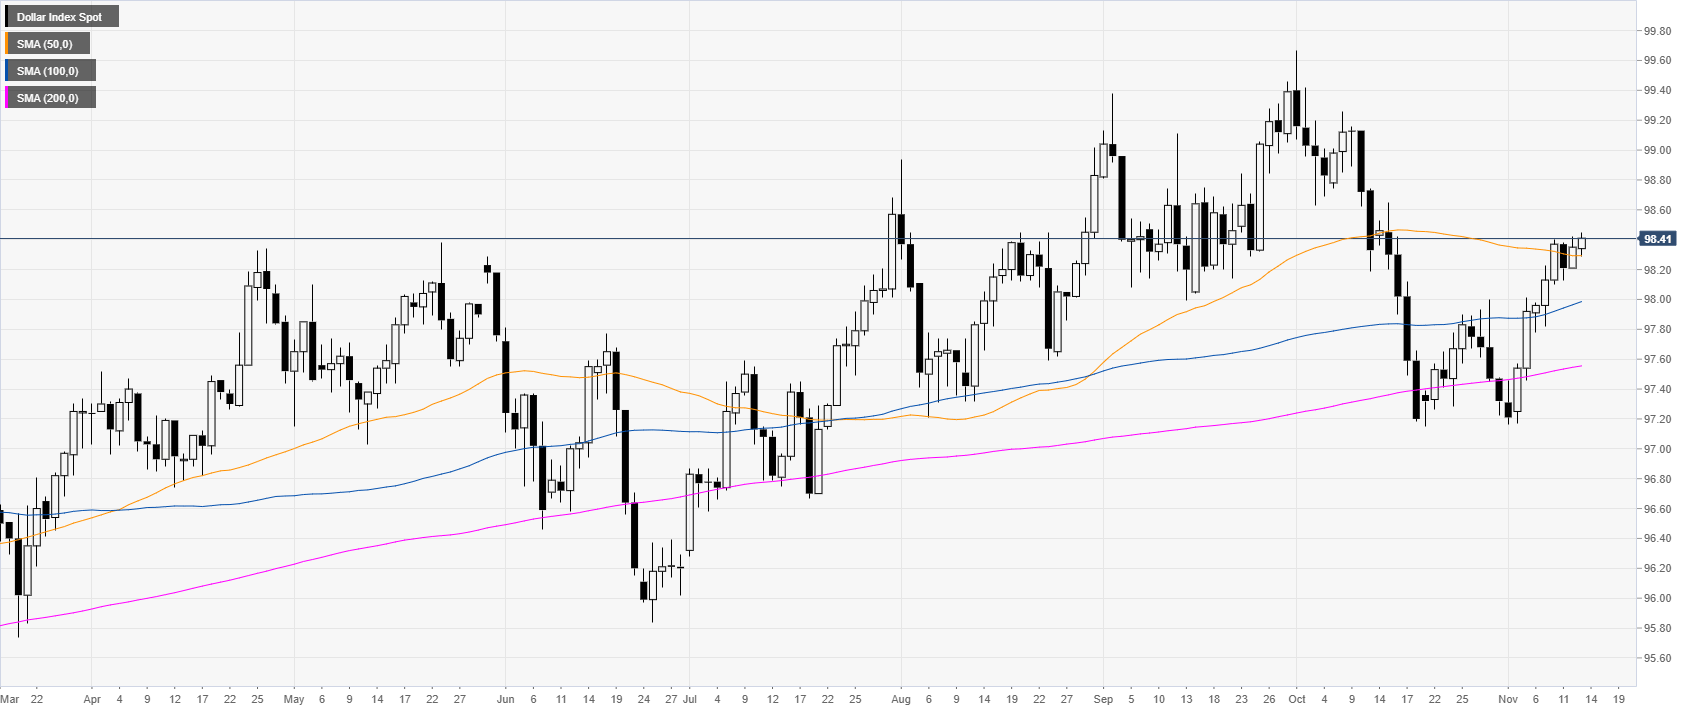
DXY daily chart
DXY (US Dollar Index) is trading in a bull trend above the main daily simple moving averages (DMAs). This Wednesday the Greenback is pressuring the 98.40 level just above the 50 DMA. Fed’s chief, Jerome Powell, is testifying on the economy before a special Congressional commission.
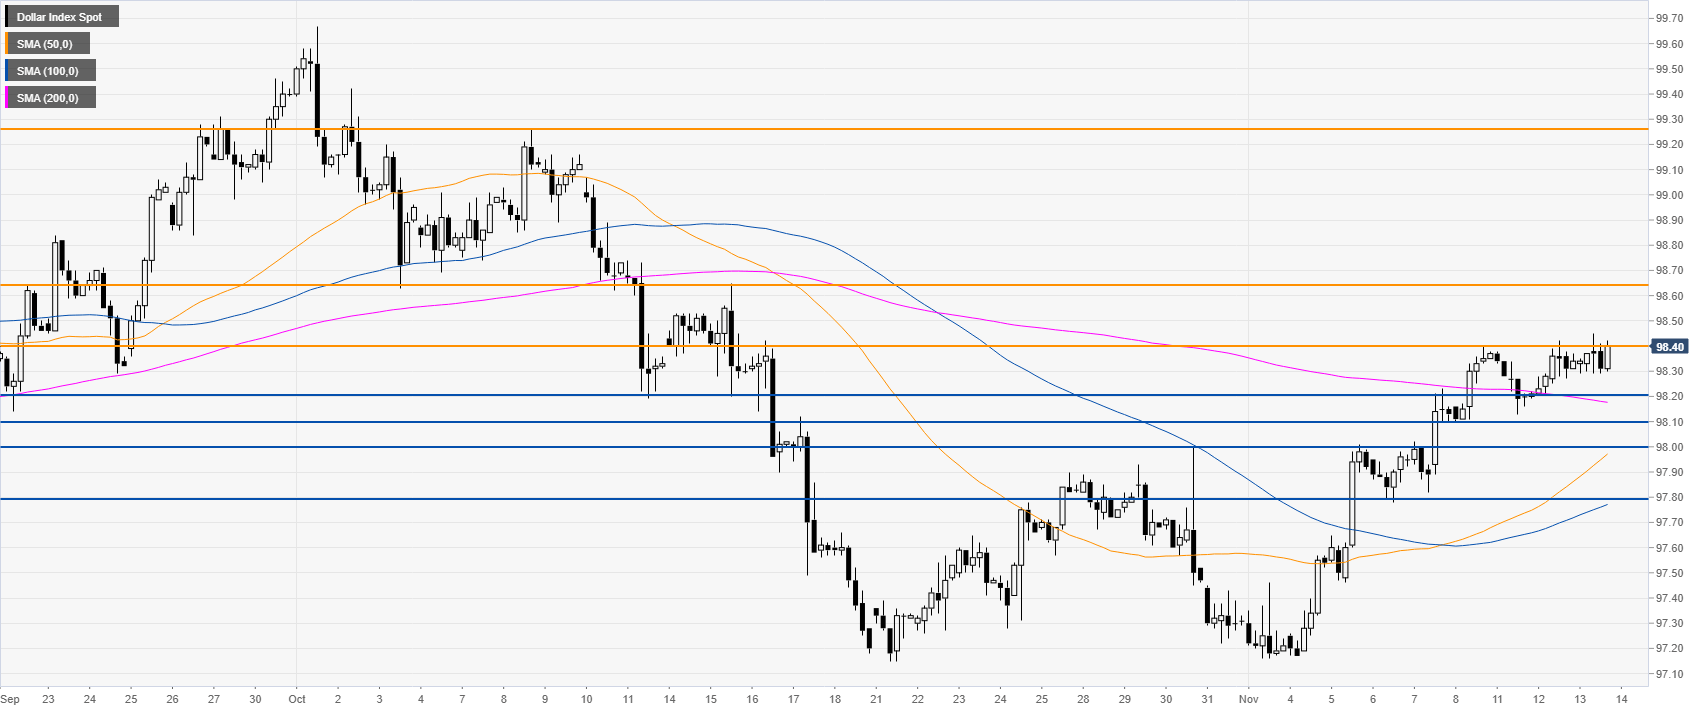
DXY 4-hour chart
DXY is clinging to monthly gains while challenging the 98.40 resistance. If the market breaks above the 98.40 resistance on a daily basis, there is room for further potential upside towards the 98.65 and the 99.26 resistances.
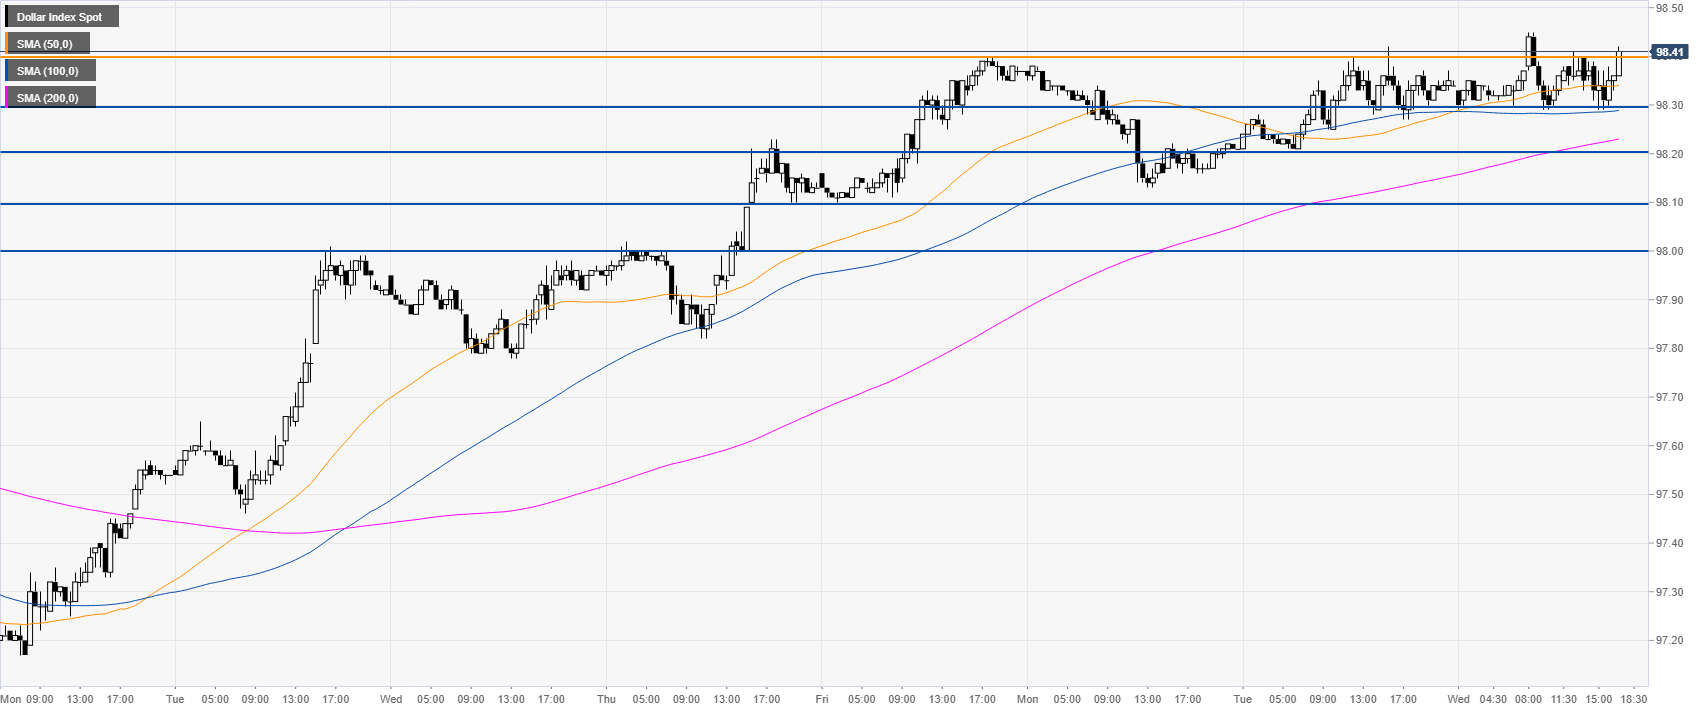
DXY 30-minute chart
DXY is trading above its main SMAs, suggesting bullish momentum in the short term. Support is seen at the 98.30, 98.20 and 98.10 levels.
Additional key levels
