- DXY is recovering slightly after being on the back foot this Wednesday.
- The level to beat for bulls is 97.30 and 97.55.
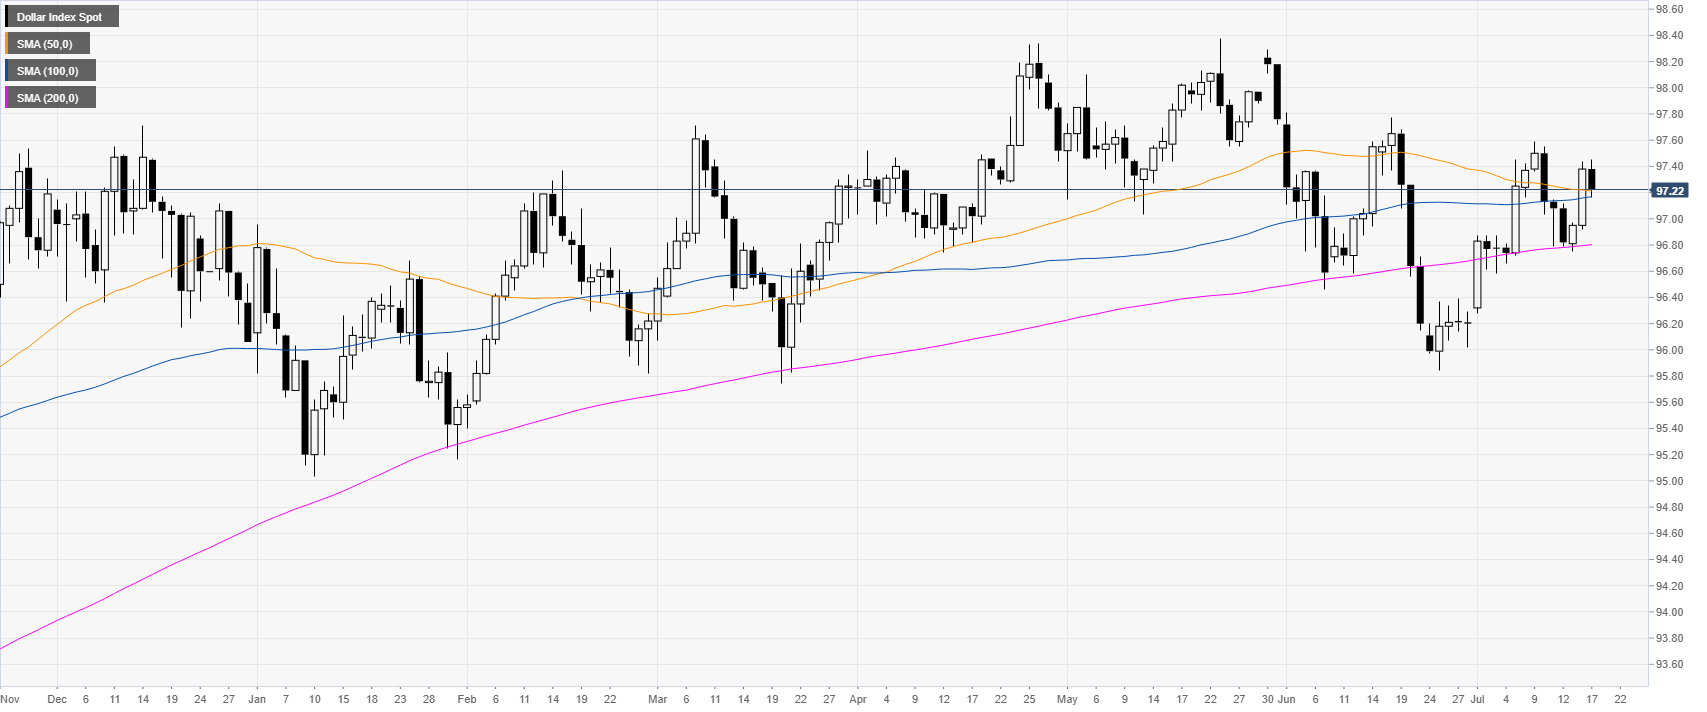
DXY daily chart
The US Dollar Index (DXY) had a small consolidation day this Wednesday. It is trading in a bull trend just above its main simple moving average (DSMA).
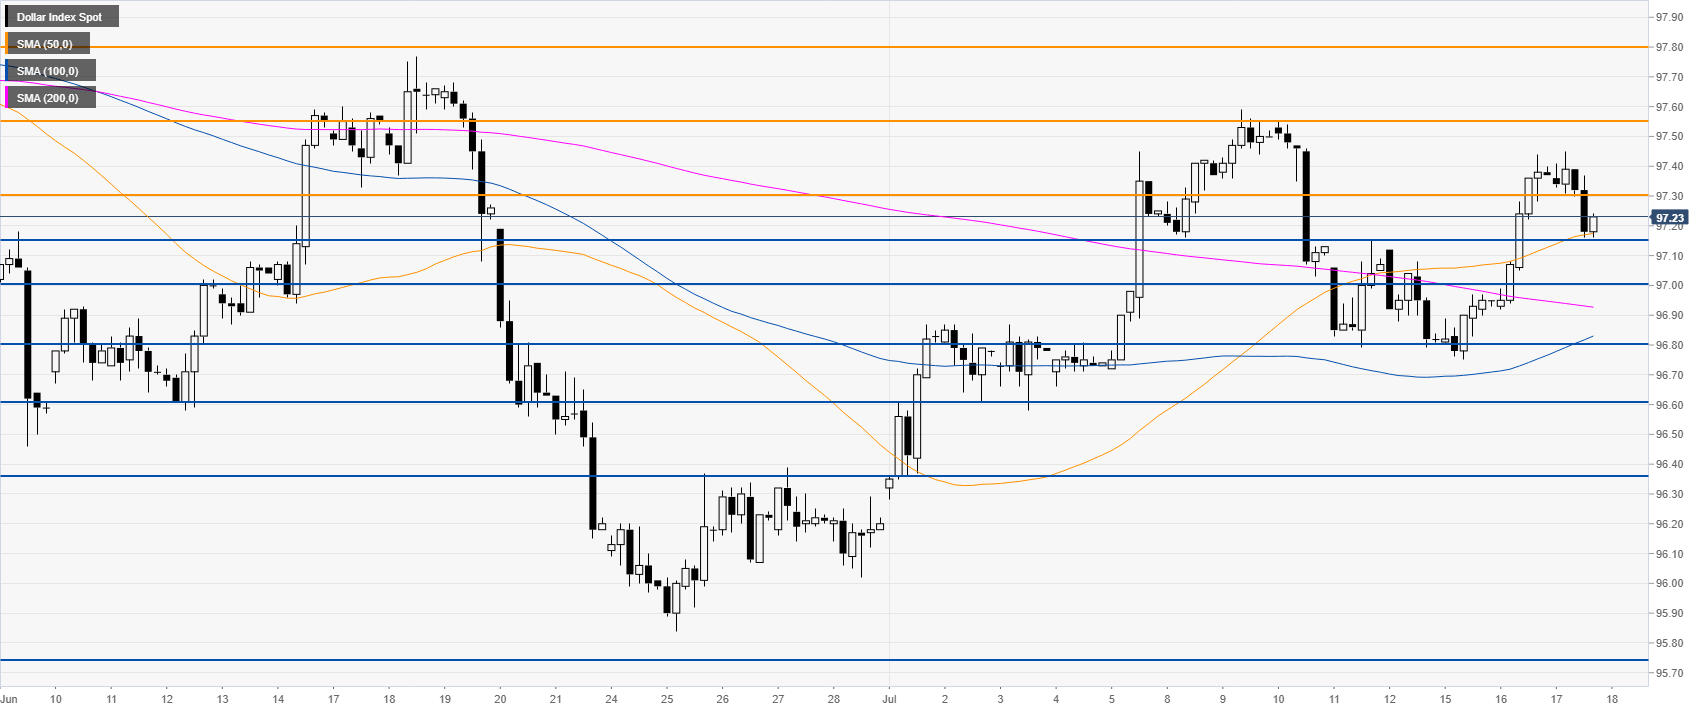
DXY 4-hour chart
The market is trading above its main SMAs suggesting bullish momentum in the medium term. Bulls would need a break above 97.30 to reach 97.55 on the way up.
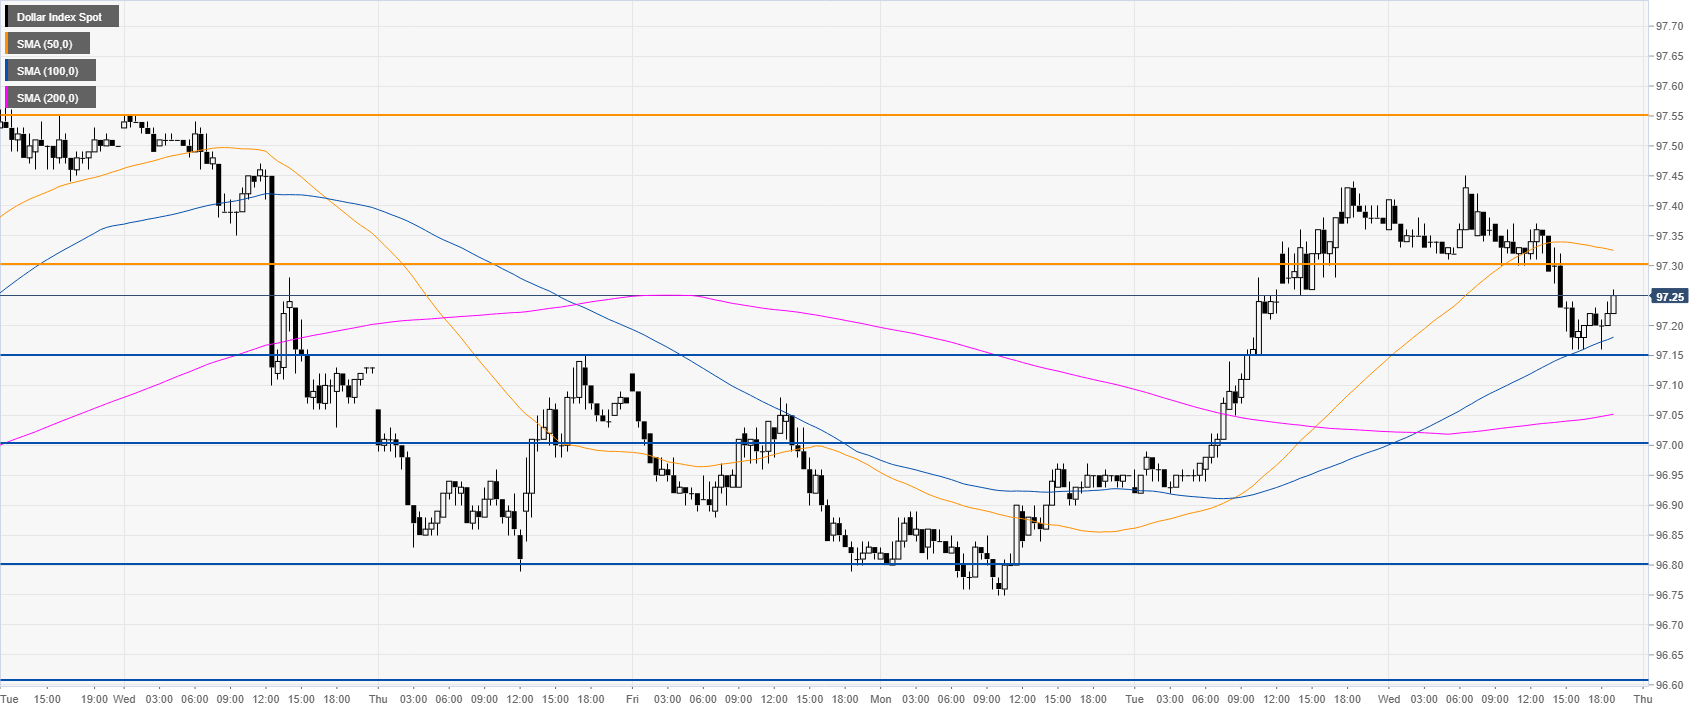
DXY 30-minute chart
DXY found some support near 97.15 and the 100 SMA. In the event the level is breached 97.00 and 96.80 can become bear targets.
Additional key levels
